

THE HISTORICAL PRICE TREND |
THE HISTORICAL PRICE TREND OF LEAD AND APPLYING THE ELLIOTT WAVEPrinciple to plot its course into the FutureAuthor - Peter Goodburn Presentation for the Battery Council International – Miami, USATable of contents
|
|
IntroductionThis presentation attempts to describe the relationship between Universal Principles & Nature's Laws and how these can be understood, translated into the Elliott Wave Principle and ultimately applied to determine the future course, trend and amplitude of Lead prices during the next decade. Lead's long history is well documented and can be traced back to as early as 6400BC but its greatest use in the preindustrial era was during the Roman Empire when its malleable qualities were perfected in creating piping as water distribution channels for hot spring baths – see fig #1 - [Wikipedia - no copyright restriction]. Fast forward almost two thousand years and we arrive at the period of the industrial revolution when primary lead production was increasing rapidly around the globe with prices trading around 4 cents lb. or about US$88 dollars tonne – see fig #2. It peaked during the roaring twenties, in 1925 at 17 cents lb. (US$376.00 mt) then declined to a low of 3.26 cents in 1932 (US$72.00 mt), the low point of the Great Depression and from an historical perspective, our reference point in determining its course and price amplitude into the future. Price rises did occur afterwards but modestly and this was due to the Lead & Zinc Mining Stabilisation Program of 1961 that was enacted to protect miners if the lead price dropped below 14.50 cents lb. (US$319.66 mt) but a little later, another problem arose – inflation. Anti-inflationary controls were introduced after 1969 but were ultimately lifted in December 1973 and it was then that prices rose exponentially into a peak of 62.95 cents lb. (US$1388 mt) by 1979. The interest in making an assessment of lead's future price course and amplitude is clear – price is directly correlated to demand and so any insight into its future direction and amplitude would enable industry to anticipate increases and decreases over varying time periods for planning and adapting to those changes. Without exception, this has become a necessary function in an increasingly competitive world and especially relevant to Lead and its related industries and their place within the growth cycles of global expansionism. And so this question has to be asked - is it really possible to create a concise and reliable picture of what price activity will look like during the next ten years and beyond? To answer that, I am now going to take you on a journey that breaks away from contemporary analytical conventionalism, and instead draw upon and refer to the qualities of philosophy, form, pattern & proportion, in fact, all the aspects of the ancient world that were used and taught in the times of the great Egyptian dynastic era and later, the philosophical schools of Greece. In these we thread the connection between Universal Principles and how that translates into the qualities embedded within the historical price activity of Lead. The great philosopher, Pythagoras (570-495BC) was known to have studied Egyptian wisdom, later indoctrinating the concepts and values that 'number' constitutes the essence of everything – this later formed the related notions of ratio, proportion and form – see fig #3 - [Wikipedia - no copyright restriction]. Mathematics and geometry, the measurement of lines and angles within spatial patterns were considered to be intimately related. This concept of 'Universal Harmony' was created by Plato as 'ideal forms' – in geometric terms expressed as the Platonic solids. These archetypal patterns so invisible themselves are continuously ensuring rhythmic repetition as patterns and form which we can recognise in the material world that we live in. Pythagoras included in his musical doctrine and the idea of the golden section phi that allows us to perceive the unchangeable rhythm behind the evident, the unchangeable 'proportion' behind the timely expression.1 Pythagoreans also thought of pattern containing 'causal' properties - this evolves as a continuous process, with 'cause' resulting in a particular 'effect' whilst simultaneously becoming the causation for the next effect, ad infinitum. 2 |
 fig #1 | Lead pipe in Roman bath in Bath, Somerset, England. [Wikipedia - no copyright restriction]
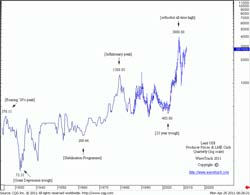 fig #2 | Long-term Lead price chart – Historical references
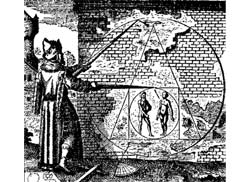 fig #3 | Pythagoras and Geometry [Wikipedia - no copyright restriction]
|
Universal Principles – Three ArchetypesAt the essence of these ideals lie in what are known as Universal Principles – unbendable tenets that are at the heart or centre of all material existence. These principles cannot be broken, but if it were possible, existence as we know it would cease – see fig#4.
Each of these Universal principles manifest in the price activity of Lead, in fact all the financial markets – they contain continuous motion (vibration), a dualistic characteristic search for equilibrium and balance (polarity) and the aspect of growth but in an alternating rhythm of advances and declines (compensation). It has long been known that in ages past, the unified harmonic idealism of the Greek school was once amalgamated with the science of the day – sadly, in modern times, as scientists began an ever increasing desire to study the microscopic universe, factually based knowledge began to outweigh the more intuitive understandings of the ancient times. But Einstein was both the modern scientist and the ancient philosopher combined and recognised in his observations of electromagnetic fields, there contained aspects of universal laws the pure scientist would never consider – that atoms were directed to follow certain patterns of behaviour, but that they also contained characteristics of causation and effect rolling forward in a continuous process. As all creation is conceived through ideas and their archetypal characteristics, in the same way we can observe these patterns in economic market activity. These repetitive ratios, corresponding proportions, number sequences and consequently patterns are also the basis for theory of technical analysis. |
 fig #4 | Universal Law List
|
Deterministic & Non-deterministic qualitiesTechnical analysis forms into two groups of categorisation – deterministic and non-deterministic methodologies. If you have ever studied a price-chart of something, let's look at Lead again, and seen a moving average overlaid onto the price data, then this type of analysis is an example of non-determinism – see fig #5. The moving average is designed to smoothout temporary erratic price movements so that the direction of trend can be discerned depending upon whether price is above or below it. It does not inform you when a new trend begins, when it may end, or how far it will travel. It simply implies that a certain trend that is already underway will continue that way until the underlying price breaks the trailing moving average. It therefore has limited value. But in a deterministic system, like the example described earlier of atoms and electrons being compelled to follow a certain path in an ordered fashion, price direction, amplitude and the pattern that it forms can be discerned because it is adhering to certain laws. Once those laws are understood, they can be applied to determine the future course of price data. |
 fig #5 | Long-term Lead price chart – Non-Deterministic Moving Average
|
The Elliott Wave PrincipleThe most prevalent price-deterministic methodology in use today is the Elliott Wave Principle3 – see fig #6/6a. It is named after its discoverer, Ralph Nelson Elliott (1871-1948) who in the early 1930's, and in the aftermath of a long illness, began a systematic study of stock market data. Elliott later published his findings in August 1938 under the title the 'Wave Principle' where he asserted that while stock market activity appears to be random and unpredictable, in fact it is quite the opposite, instead adhering to natural laws and hence following certain predictable paths of price development. These price developments built into discernable patterns that were part of a continuous process of growth and decay, progress and regress, action and reaction. In the 1940's, Elliott expanded his knowledge and refined his discoveries to include the Fibonacci summation series, 1,1,2,3,5,8,13,21,34,55,89,144,233 etc. publishing them in his final treatise named 'Nature's Law – the Secret of the Universe' in June 1946, two years before his death – see fig #7. The impact of combining the Fibonacci summation series and its developing ratios with his discoveries of repeating patterns resulted in a significant step forward in the understanding and predictability of stock market behaviour. In Nature's Law, Elliott introduces the 'Rhythm of Nature' and builds the correlation between the ordered growth cycle found within natural phenomena and the stock market. The Golden Ratio of 1.618 or its inverse 0.618 is derived from the Fibonacci summation series that can be found and measured in many of the patterns discovered by Elliott unfolding within the price data of the markets – see fig #8. |
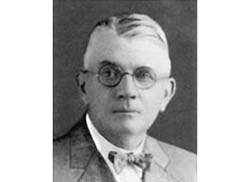 Fig #6 | R.N.Elliott
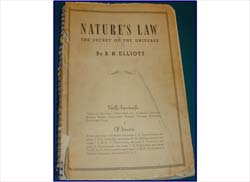 Fig #6a | Natures Law
 Fig #7 | Fibonacci Ratios
 Fig #8 | Comparative Ratio Relationship
|
The Golden Ratio – 1.618/0.618 & FractalisationHe also refers to the Great Pyramid of Giza, and illustrates how its master architects had already known about the importance of the intersection point of a line at 61.8% to reveal the 'golden section' a point along a line that exists nowhere else that conveys the idea of perfect harmony, a point of equilibrium but not equality, where the smallest segment has the same comparative ratio relationship to the largest, as the largest to the whole – see fig #9. The phi Ф ratio retains an aesthetic quality that the 'eye' can discern and it is this ratio that is evident in the natural growth patterns of plants, trees, crystalline structures, even the spirals of galaxies. The ratio 0.618 seems to be the 'frequency' that nature finds most harmonious when building, creating and even decaying within its natural cycle of evolution. The aesthetic qualities of the 'golden-ratio' and its knowledge passed from Egypt to Greece – here's another example of its use in the construction of the Parthenon, the Temple of Athena, in the Athenian district – see fig #10. What Elliott described as Nature's Law[s] are derivatives of the three Universal Principles and although he did not list these by name, he described their essence in sublime clarity. Since then, science has re-discovered the concept of selfsimilarity, a term used to define an object or pattern whose form or appearance is exactly or approximately similar to a part of itself – inversely, is self-similar as a component to the larger aggregate pattern it is part of. And in the 1960's, Benoît Mandelbrot took this concept one step further and created the term 'Fractal' that describes an object of a fragmented or non-linear geometric shape where its parts are the components of the larger, self-similar whole. A fractal object looks similar whether viewed from close-up or from a distance – see fig #11. [Wikipedia - no copyright restriction]. |
 Fig #9 | Great Pyramid of Giza
 Fig #10 | Parthenon & Golden rectangle
 Fig #11 | Self-Similarity & Fractalisation – the Mandelbrot set
|
Natures Law - Five Laws/CharacteristicsThe financial markets contain self-similar patterning, are evolving into alternating growth and decay cycles, exhibit fractalisation, are proportionally represented through comparative ratio relationships, are related by one another in a continuous seamless process and conform to a hierarchical order. If Elliott was to list his Nature's Laws, this is how they might appear: - see fig #12.
|
 Fig #12 | Nature's Laws List
|
The basic structure of the Elliott Wave conceptThe universal principle of 'Compensation' manifests in the basic structural form of an alternating action & re-action process. For example, action, progress, expansion or impulse is defined by price activity that takes the form of a five wave (price-swing) sequence. This identifies the progressive trend of the price data. This pattern is numbered as 1-2-3-4-5. Once completed, it requires a counter-balancing process to unwind, re-action, regress, contraction or corrective, and this is achieved where price activity unfolds in the form of a three wave (price-swing) sequence, developing in the opposite direction to the preceding sequence, and assigned letters A-B-C – see fig #13. This process is not exclusive to one direction – a trend can develop in either an advance or a decline – see fig #13a. Fractalisation occurs throughout the entirety of the data-set. The five wave impulse pattern contains three wave sequences unfolding into one direction, the general direction of the complete form whilst being interspersed with two movements in the opposite direction. The three moving in the same direction are the 'impulse' sequences of the larger impulse and thus subdivide into smaller five wave sequences, proving self-similarity whilst the two unfolding in the opposite direction subdivide into smaller three wave sequences. |
 Fig #13 | Action - Reaction within uptrend
 Fig #13a | Action - Reaction within downtrend
|
Hierarchy of order | EW-NomenclatureIn order to establish the correct construct of ongoing development, it is necessary to assign a hierarchy of nomenclature, numbers & letters – see fig #14. Once a five wave pattern has completed, it is assigned a number or letter according to its location within the larger ongoing pattern it is part of. |
 Fig #14 | Hierarchy of order | Elliott Wave Nomenclature
|
13 PatternsElliott originally documented eleven basic but specific patterns that replicate in the markets but it is generally accepted that this list becomes thirteen – see fig #15. They break down into two groups, action and re-action or impulse and corrective. There are two archetypal impulse patterns, the expanding-impulse and the diagonal-impulse, and three for corrective, the zig zag, the flat and the triangle. Each has several derivatives but the basic form remains constant – see fig's #16-20. |
 Fig #15 | 13 Patterns
 Fig #16 | Archetype pattern of expanding 5 wave impulse & derivatives (trend/action/progress)
 Fig #17 | Archetype pattern of both diagonals & derivatives (trend/action/progress)
 Fig #18 | Archetype pattern of single zig zag & derivatives (counter-trend/re-action/regress)
 Fig #19 | Archetype pattern of flat-horizontal & derivatives (counter-trend/re-action/regress)
 Fig #20 | Archetype pattern of triangle & derivatives (counter-trend/re-action/regress)
|
Applying Pattern and Ratio to Lead PricesReturning to the lead chart, this time, equipped with knowledge of pattern, ratio and proportion together with an understanding of Elliott's wave counting process, we can begin to build an overlay of number and letter to the evolving price data. As the low in 1932 at US$72 dollars per metric tonne was an 'extreme', our counting process begins from there – see fig #21. The Long-term uptrend/progression/expansion phaseThe data-set adheres to typical Elliott Wave patterning. The initial advance from 72 completes to 350 and then falls back quickly to 97 but does not break the preceding low. Expansion then begins in earnest and is mostly uninterrupted until it reaches 1388 in the year 1979. These sequences are characteristic behaviour of 1st, 2nd and 3rd wave development. Interestingly enough, the 3rd wave unfolded to a fib. 161.8% ratio of the 1st wave. The next 23 year period underwent regression or counter-trend correction, the balancing effect of the 3rd wave and labelled as the 4th wave sequence. It developed into a descending triangle pattern ending at 405 in September 2002. The horizontal lows formed three consecutive attempts to the same price level, but importantly, completing at the Fibonacci 50% retracement area of the preceding advance of wave 3. The next advance is represented as the 5th wave, and there exists a finite amount of Fibonacci price ratio measurements that can be applied in measuring an ultimate high for this wave sequence. In this case, extending waves 1-4 by a fib. 161.8% ratio does depict an almost exact terminal high at 3980 in October 2007. This suggests with a high degree of confidence that a five wave impulse pattern has completed from the low in 1932 to the high in 2007. I would assign a high probability that the long-term uptrend has completed at 3980 in October 2007 and that a multi-year counter-trend balancing sequence must unfold. |
 Fig #21 | Long-term Lead price chart with Elliott Wave overlay and forecast
|
The Long-term downtrend/regression/contraction phaseThis must unwind proportionately to the preceding uptrend – comparing like-for-like movements both in terms of time and price ratio amplitude. Early in this process, it is not known in what pattern form the counter-trend decline of price action will take. But one of Elliott's guidelines is useful to remember – a counter-trend will have a tendency to return back towards the area of the 4th wave price territory of the preceding movement – in this case, towards the US$405 dollar level. To my satisfaction, I have found this characteristic unfolding as much as 80% per cent of the time, but of course, over smaller time periods than this one. Lead prices tumbled after reaching 3980. It marked the beginning of the bear trend. The decline formed a low at 875 (cash – 845 basis LME 3mths), but this low did not return prices to the US$405 level as Elliott's guideline indicated. Despite this, the true identity of the pattern of the bear market began to materialise. Upon closer inspection, the decline from US$3900 (Oct.'07) to 845 (Dec.'08) was identified as unfolding into a double zig zag sequence, A-B-C-X-A-B-C. In particular, there existed exact ratio and proportional dimensions embedded within the pattern – see fig #22. |
 Fig #22 | Double zig zag pattern (3900-845) exhibits 'Golden-Ratio'
|
|
Let's take a closer look. The overall decline has a definite seven price-swing form, consistent with a double zig zag pattern – furthermore, extending the first zig zag by a fib. 61.8% ratio projects the conclusion (low) of the secondary zig zag to a downside target price level at 853 – the actual low was recorded at 845. This is the 'golden ratio' working to perfection! Now compare this pattern to the double zig zag archetype in this tutorial example – see fig #23. The double zig zag pattern is itself completed at the price level of 845, but in doing so, it did not fulfill Elliott's guideline that a completed counter-trend would terminate towards the price area of the preceding 4th wave (405). The solution to this puzzle is quite simple – the double zig zag decline to 845 is only 'part' of an even larger counter-trend pattern – of an expanding flat – see fig #23a. And so it seems probable that the long-term counter-trend is taking the form of an expanding flat pattern. It is just one of the three archetypal counter-balancing patterns we saw earlier. Interestingly enough, this pattern has a tendency to manifest when the initial phase of a counter-trend fails to fully return to the area of 4th wave of preceding degree – also when it has only taken a fractional amount of time, rather disproportionate compared to the 75 years it took to complete the uptrend! More price and time consumption is required to balance the preceding bull market sequence, and this pattern will achieve that! The fascinating aspect of the expanding flat is that it requires prices to momentarily trade into a new price extreme, in the case for Lead, prices break above the 'orthodox' high that established the termination of the bull market, at 3900 in Oct.'07. This function of the pattern is mostly overlooked and goes unnoticed by the financial community, yet it is one of the most common an frequently occurring phenomenon to manifest. |
 Fig #23 & 23a | Double zig zag & expanding flat tutorial patterns | ©WaveSearch by WaveTrack International
|
|
The pattern is composed of three main price-swings, or waves, assigned cycle degree status according to the larger picture, A-B-C – see fig #24. We have already identified cycle wave A ending into the 845 low of Dec.'08 and the subsequent advance is therefore wave B with an ultimate upside price target somewhere above the 'orthodox' record high of 3900. In order to measure the terminal high for cycle wave B, two fib-price-ratio measurements are used. The first is to extend cycle wave A above 3900 by three various ratios, all derivatives of the Fibonacci Summation series, 14.58%, 23.6% or 38.2%. In order to determine which one will ultimately form the terminal high for cycle wave B, we must cut each one by a fib. 61.8% ratio to create the 'golden-section'. Using a logarithmic scale, the projected levels are 4875, 5585 and 6995 respectively. Next, we must examine the pattern that is evolving as cycle wave B – can it be identified? It can only develop into one of the three archetypes, the zig zag because the flat and the triangle would not translate into price forming into a new price extreme (record high). As we already know from cycle wave A, the derivative of the zig zag is the double or triple pattern sequence, so these can be considered as well. In actual fact, when examining the pattern contained in the advance from 845, a straight line advance unfolded to 2695 implying the overall progression will assume the form of a single zig zag pattern, labelled in smaller, primary degree, A-B-C. Primary wave A ended already at 2695 identified because it also fractalised or subdivide into a smaller five wave pattern, a necessary function. This has provided important information that will help determine the ultimate high for cycle wave B. If cycle wave B is unfolding into a single zig zag, then extending primary wave A of this pattern by a fib. 61.8% ratio will provide the final target level for primary wave C of B, and magically, this converges at 5585, the fib. 23.6% extension level of cycle wave A measured earlier. And so now, with an element of high probability, we discover a convergence of price at 5585 that becomes the price candidate for ending cycle wave B. Looking ahead, should prices trade at this area then stage rejection followed by a reversal signature, then validation will be complete. It simultaneously confirms the beginning of the third and final sequence of the expanding flat pattern as cycle wave C. Like its 'B' wave counterpart, wave C must finalise by a fib-price-ratio beyond wave A's low of 845. Using the same formulae, a fib. 38.2% extension ratio was used because this allows prices to trade more closely towards the area of 4th wave preceding degree that Elliott's guidelines suggested for the termination of the counter-trend phase. This projects a conclusion towards 475+/- representing a decline of minus -91.49% in value measuring from top to bottom. |
 Fig #24 | Lead chart – long term downtrend as expanding flat pattern
|
ConclusionIt seems almost unimaginable that such an event could occur – but then why does the mind resist even the most logical facts when presented? Look at changes throughout history to grasp examples of significant change. Consider this - who could have anticipated the Great Depression especially during the preceding decade of the Roaring Twenties? Probably the more important question relates to, 'How would this affect our surroundings, our environment, our families, and our businesses that support them?' That's a good question – its profound implications for each of us to consider by ourselves. |
|
Biography Peter GoodburnPeter’s background in finance began in the commodities markets of the late 1970’s, prior to the peak of the inflation period of the early 1980’s. He was trading on the floor of the London Metals Exchange for those early years and later created the first OTC NY Comex copper option contract with loco/London delivery. A year or so later, he developed option evaluation software called OPVAL that is currently used by major banks and corporates to this day. Peter was introduced to the Elliott Wave Principle in 1985 and soon afterwards in 1987 became a full member of the Society of Technical Analysts and various other professional organisations. His first company was named Waterside based alongside Canary Wharf, an Introducing Brokerage created in early 1988 that provided trading facilities and research for an intuitional client base with over US$100 million credit lines. WaveTrack was the flagship Elliott Wave research product distributed weekly including forecasts on commodities, forex, equities and bonds. This is his specialised methodology, and he has since taught the Elliott Wave Principle to many professionals over the last two decades - also students at the London School of Economics as part of the STA/IFTA diploma programme. WaveTrack International was incorporated over ten years ago and its mandate is to guide institutions through the directional trends/counter-trends of the markets.
1 Plato - "The Republic", "Phaedus" & "Parmenides" END | FIN | ENDE |
