TRACK RECORD – HANG SENG INDEX 2011 |
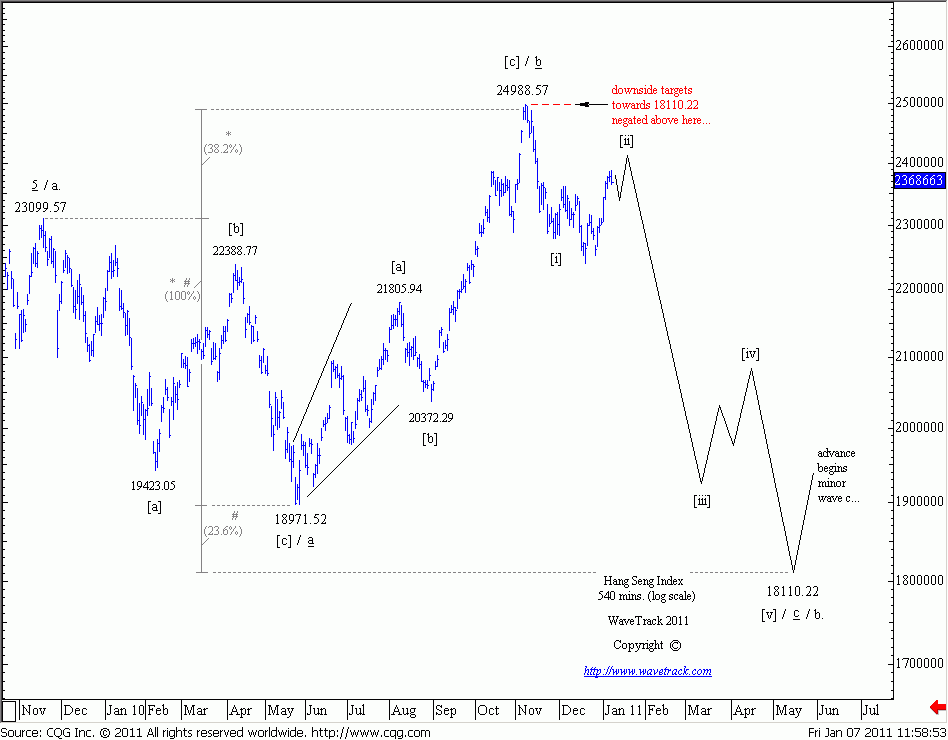
FIRST HALF-YEAR REVIEW OF HANG SENG INDEX FORECASTSThe first half of the year has seen some volatile price-swings for the Hang Seng and until recently, most of this taking place within a sideways trading range between 22123.26 and the year's high of 24468.64. We open this track-record in early January ‘11 with two competing wave counts with an outlook of 12 months forward. Count #1 illustrated a bearish outlook with an expanding flat correction in progress that began from the Nov.'09 high of 23099.57 with ultimate downside targets to 18110.22. Count #2 proposed a more bullish outlook that prolonged the May '10 advance unfolding as a five wave impulse pattern into the May-June '11 cycle high targeting 27316.16. |
Table of Content |
Hang Seng Index I. - January 7th 2011 & January 19th 2011 |
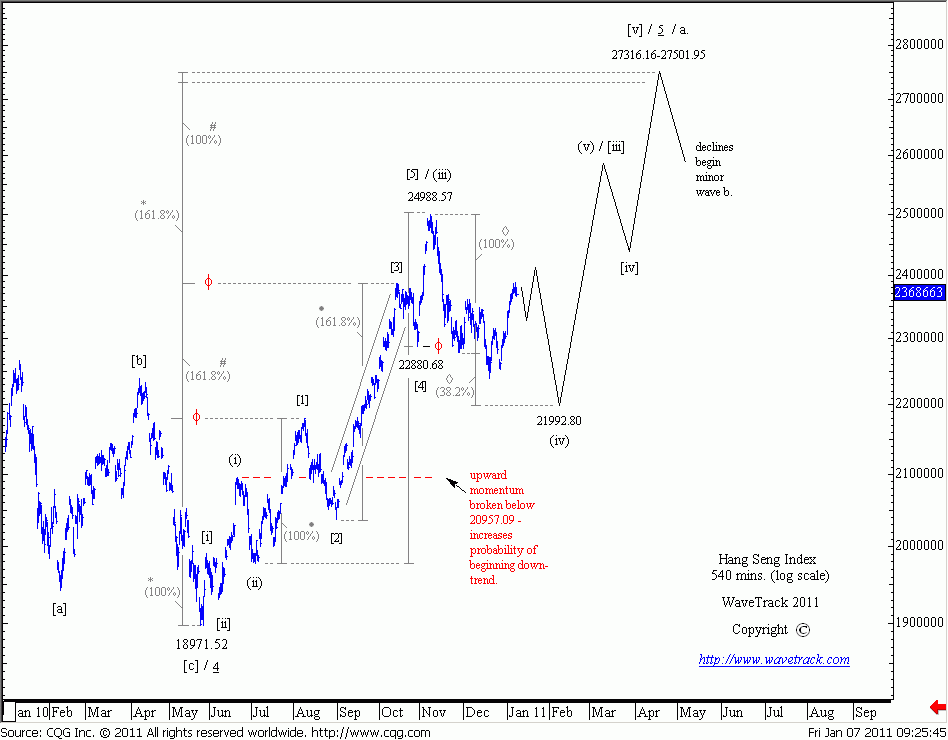
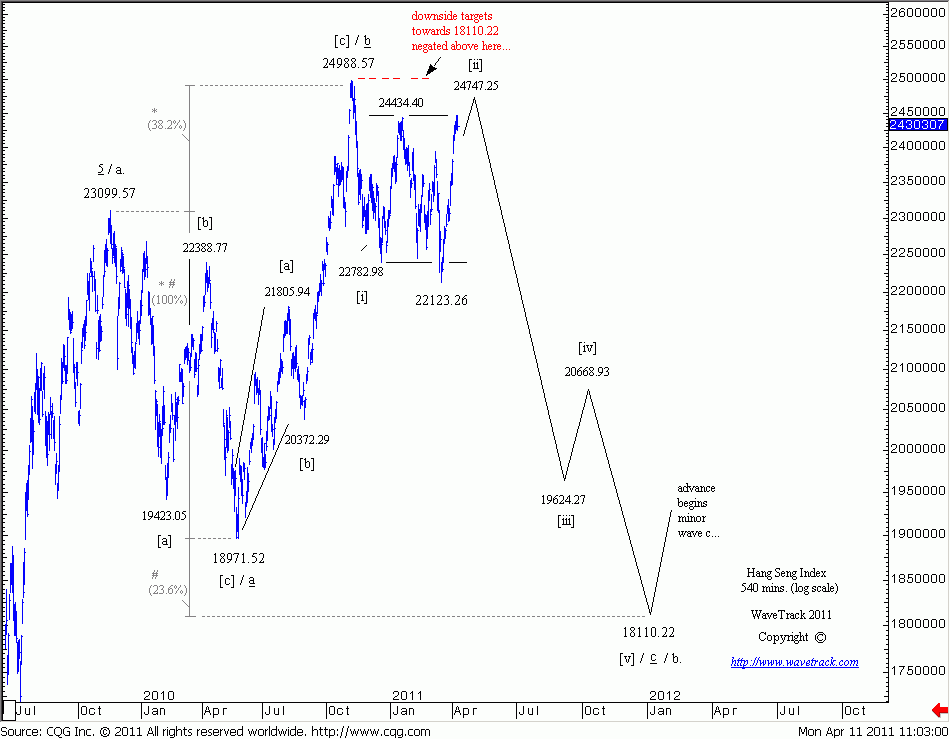
January 7th 2011 - Despite the obvious differences between these two forecasts, the interesting aspect at the time these were published was that both shared a short-term commonality – prices would continue a little higher from current levels of 23686.63 but would end their run below the Nov.'10 high of 24988.57 then turn sharply lower - see fig #1. As count #1, this would begin a 3rd wave accelerative decline with targets levels below the existing Dec.'10 low of 22392.67 whilst for count #2, it would end a counter-trend zig zag pattern as a 4th wave to 21992.80 - see fig #2. And so both scenarios forecast a rapid decline to at least 21992.80. |
|
January 19th 2011 - prices did trade a little higher ending at 24434.40 and then declined exactly as forecast, completing at 22123.26 on the 17th March, just a fraction above the minimum downside targets of 21992.80. This decline represented a minus -9.45% per cent decline. The index then turned higher - once again such action was consistent for short-term price action for both counts #1 & #2 – for the former as simply a 2nd wave rally and the latter as part of a five wave impulse advance into higher highs. |
|
Hang Seng Index II. - April 11th 2011 |
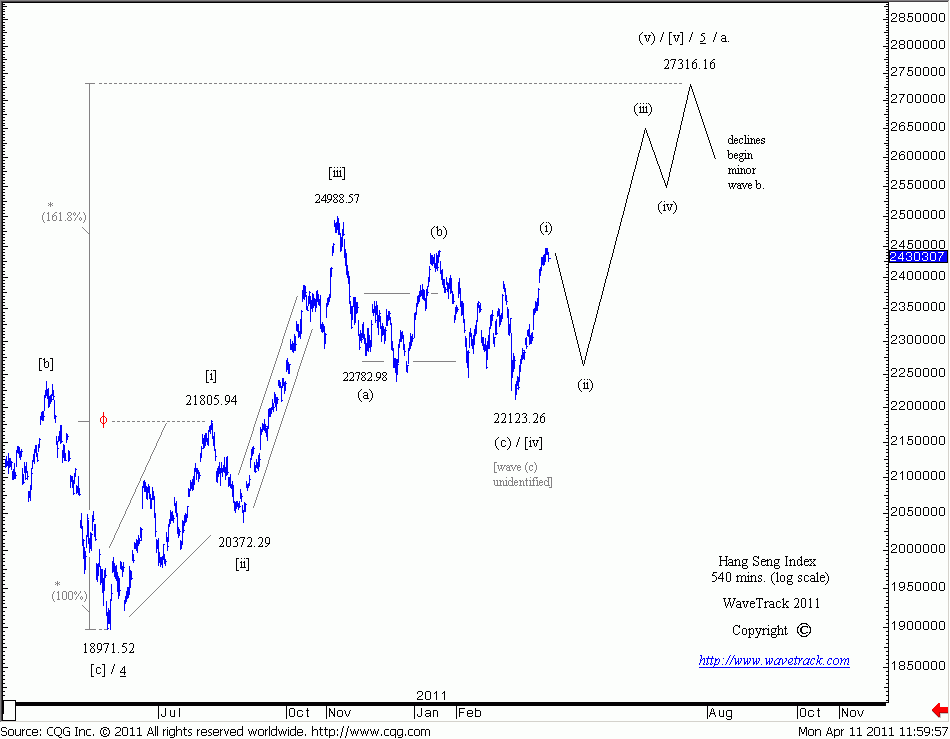
April 11th 2011 – The advance from the March low of 22123.26 headed higher until reaching the next upside target level into the second week of April – a total upswing of +10.60% per cent. Basis the original bearish count #1 scenario, prices were again heading towards maximum upside target levels as a 2nd wave rally with forecasts for an imminent turn lower. This was conditional on prices staging a reversal from below the Nov.'10 high of 24988.57 – see fig #3. Now compare this to the original bullish count #2 scenario – this count labelled the advance as completing the 1st wave of the larger impulse pattern with forecasts for an imminent reversal that begins a deep 2nd wave retracement decline – see fig #4. Again, there is short-term synchronisation of both counts as they now demonstrate the necessity for declines as either a 3rd wave (within downtrend) or a 2nd wave retracement (within uptrend) . |
|
At this point it was important to highlight the negation levels for each. To negate the bearish count #1 scenario, prices must remain below the Nov.'10 high of 24988.57 – for the bullish count, prices must remain above the ‘overlap' high of the 1st wave at 21805.94 of the larger impulse in progress from the May '10 low. For the time being, both remain valid. |
|
Hang Seng Index III . - May 24th 2011 |
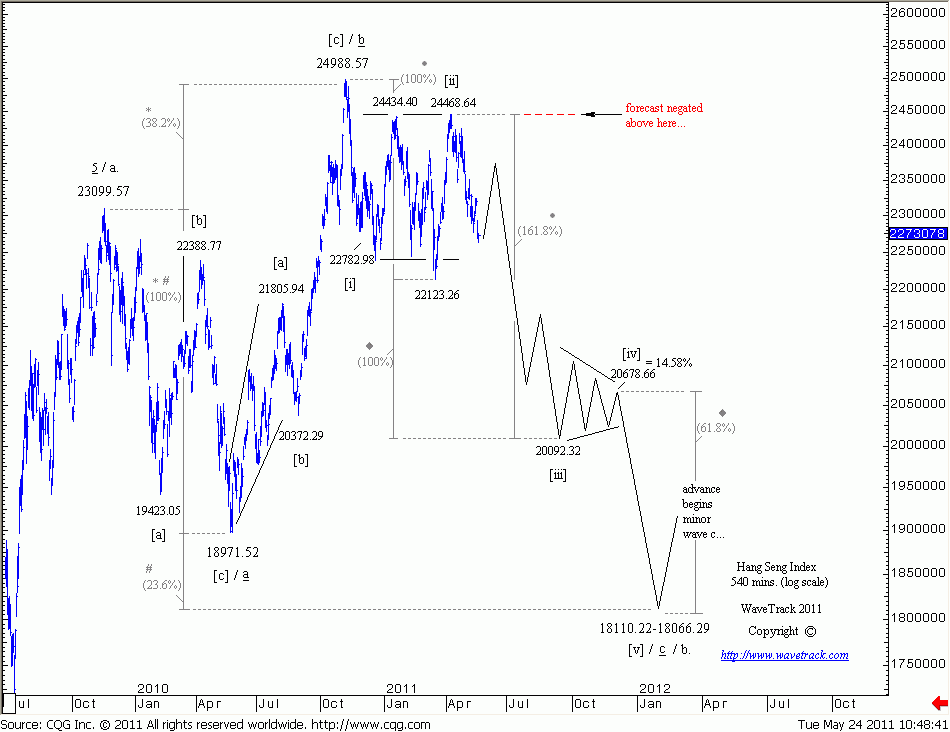
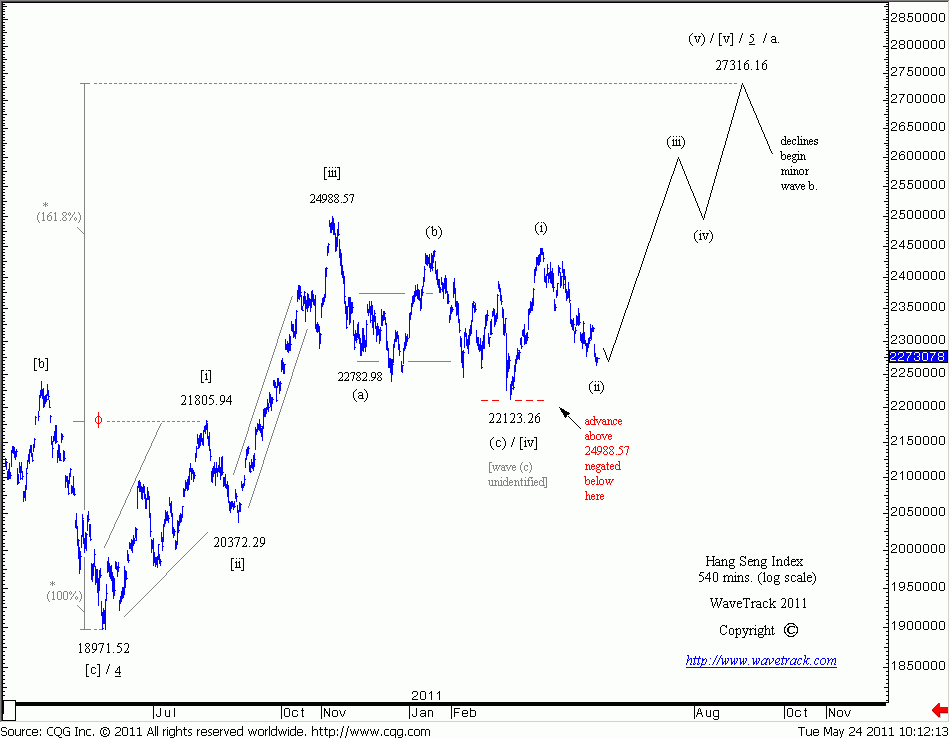
May 24th 2011 – Declines from the early April high of 24468.64 did unfold as forecast, trading down to the 25th May low of 22519.66, a loss of minus -7.96% per cent. A day earlier, the update alert published the latest forecast citing a low was forming with price expectations of a sizable advance to begin as either a 2nd wave within the bearish count #1 scenario, alternatively beginning a accelerative 3rd wave advance as part of the next sequence of bullish count #2 – compare fig's #5 & #6. |
|
As yet, there was nothing to differentiate between these two counts – both were now consistent in forecasting the Hang Seng higher. Naturally, basis the bearish count, the rally was limited to complete below 24468.64 whilst the bullish count required a break of the 24468.64 & 24988.57 highs. As the days followed, the Hang Seng did rally, trading to 23707.95, a gain of +5.27% per cent but the index then turned down very hard. |
|
Hang Seng Index IV . - June 14th 2011 & June 21st 2011 |
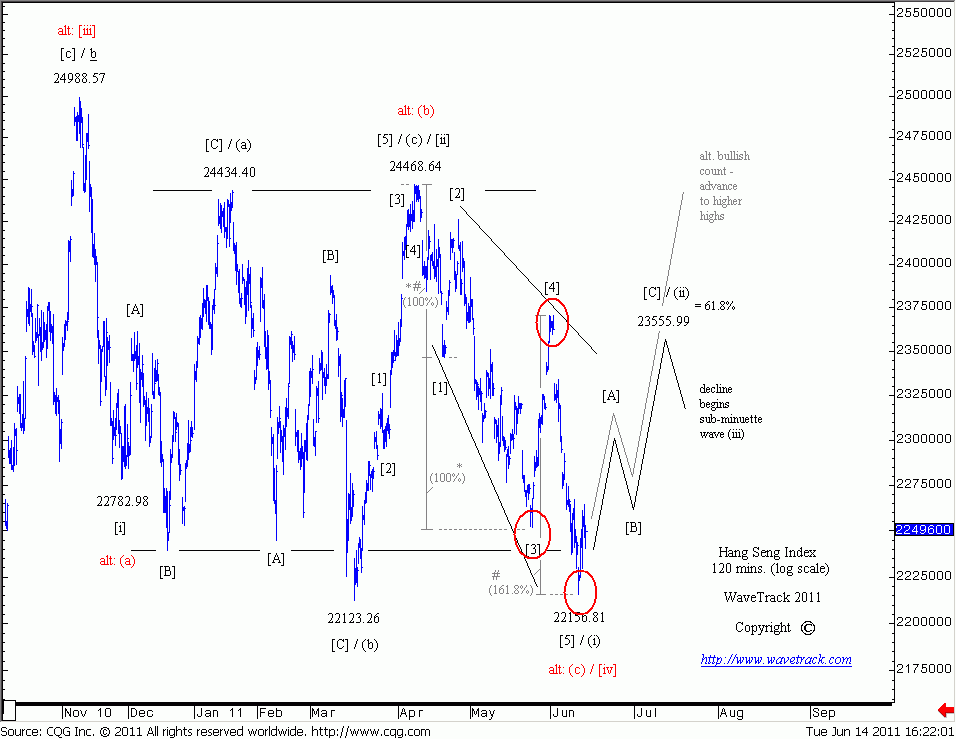
June 14th 2011 – This short-term update continued to find consistency in price action for both bearish and bullish counts. As the bearish count #1 scenario, the recent up and down swings shown circled (red) represented the conclusion of a leading-expanding diagonal pattern as the 1st wave of a more progressive decline - the bullish count #2 scenario amended the wave count slightly describing this same low at 22156.81 as the 4th wave of the counter-trend decline that began from the Nov.'10 highs – see fig #7. The short-term consistency for both required an upswing and its amplitude obviously depended upon which of the two counts were in fact correct. |
|
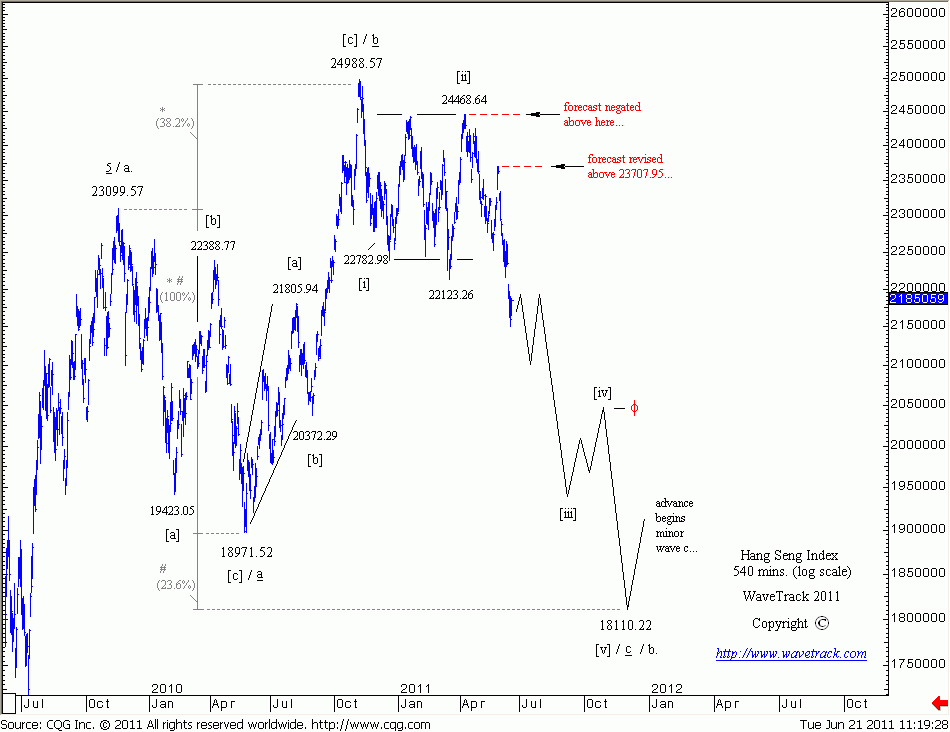
June 21st 2011 – The week of realisation finally arrived. The Hang Seng failed to push higher from the 22156.81 level and this was the first occasion during the year that price-action diverged from the mutual short-term forecasts that had bounded both counts together. The index not only weakened further but more importantly, it broke the important ‘overlap' of the 1st wave at 21805.94 operating under the larger bullish impulse pattern of count #2 – in other words, it negated the bullish count altogether, leaving the bearish count #1 as the only count remaining in the existing portfolio – see fig #8. |
|
Commentary – 21st June 2011The current options for forecasting the Hang Seng remain limited since the bullish count has now been eliminated. Short-term activity can produce some upside effect, but this will remain classified as a counter-trend pattern within the larger bearish development. Downside targets for the next several months remain towards 18110.22, the same levels published in January, as the concluding sequence within the larger expanding flat pattern that began from the Nov.’09 highs of 23099.57. Only an advance |
|
Latest update – 7th September 2011 |
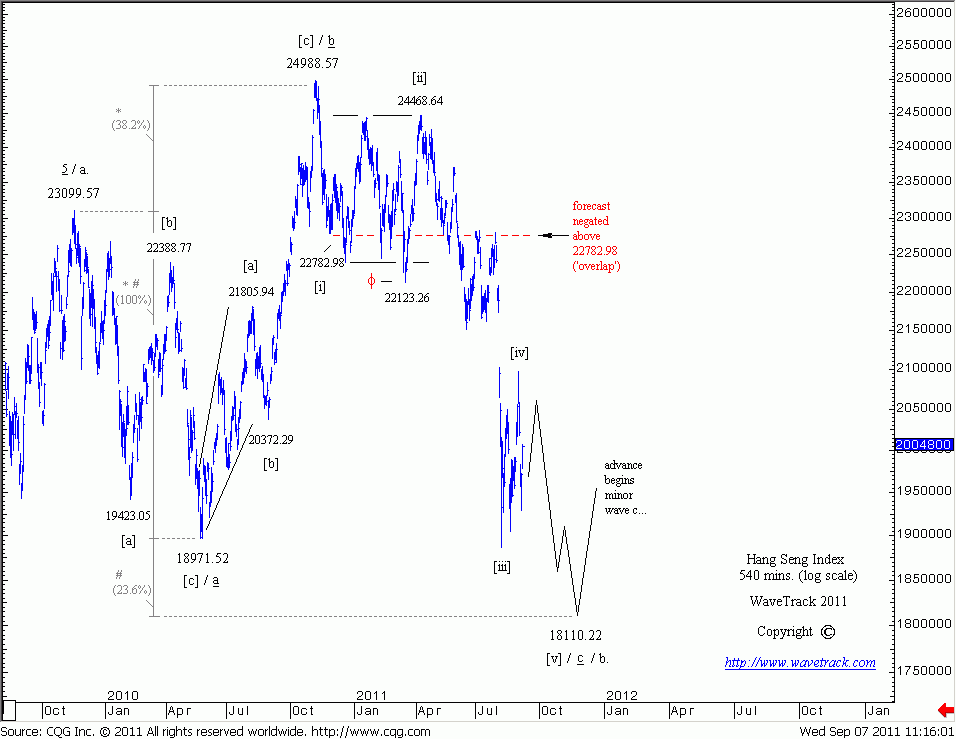
7th September 2011: Early August produced the ‘expansionary' phase of declines that are associated with 3rd of 3rd wave activity – see fig #9. As minuette wave [iii] three, this is characterised by the opening of a gap and a continued thrust lower that ultimately ended this 3rd wave at 18868.11 on the 9th August '11. Notice how this closely followed the path described in the previous update of the 21st June (fig #8). The impulse pattern that began minute wave c from the Nov.'10 high of 24988.57 remains incomplete, requiring a final 5th wave to develop into the 18110.22 target area. It is possible that the fib. 23.6% extension of minute wave a that produced this target is exceeded slightly with the next fib. 38.2% level projecting 17600.92+/-. Overall, this application of Elliott Wave to a real-life example of a major index such as the Hang Seng provides an excellent insight in how the combination of pattern identification and Fibonacci ratio & proportion analysis is used to forecast not only price direction and amplitudes but also the interim up and down swings to a fine degree of accuracy. |
|
END | FIN | ENDE |
