

TRACK RECORD |
INTRODUCTION TO THE FIXED INCOME FORECASTING SERVICESWaveTrack has specialised in applying R.N.Elliott's Wave Principle to the financial markets for over twenty years, both as traders and researchers. Publishing price forecasts for the financial community, the Fixed Income Forecasting Service has served a wide spectrum of institutional clients worldwide, spanning five continents since its inauguration in 1988. Our cooperation with mainstream banks and their clients has produced a growing awareness of the robustness of the Elliott Wave Principle as a forecasting tool, and its place within the hedge fund and real-asset businesses is now firmly established. Two principle activities are focused upon – the continuous streaming of updated forecasts are being relayed via our web-site portal and the education & tutorial services that support the clients for the translation and practical implementation of trading strategies. WaveTrack's unique application of the Wave Principle involves the building of a matrix of fibprice-ratios overlaying the differing wave nomenclature, or degrees of waves that have unfolded over time periods ranging from many decades to just intra-day minute movements. When these converge with a specific Elliott Wave pattern, the probability of forecasting the subsequent price swing is increased exponentially. Short-term opportunities do occur, and they will at times produce some larger movements normally associated with sequences of larger time-frames, but our focus is generally providing forecasts for the implementation of campaign strategies lasting several weeks and months and often longer. The following charts offer a momentary glimpse into a few but atypical long & medium-term track-record examples of forecasts published for the US 10yr Treasury yield - the publication date is followed by a description of the unfolding story of how Elliott Wave applied to medium and long-term trends were combined to reveal a near-exact path interest rates were later to follow during a seven year period. |
EW-Forecast
Table of Content |
US 10 YR YIELD - SEPTEMBER 20th 2001
fig 1 10yr Yield - Monthly |
September 20th 2001 – This chart depicts the long-term downtrend unfolding into a double zig zag pattern as super-cycle wave B . It is labelled subdividing into cycle degree, A-B-C-X-A-B-C. The secondary C wave is shown unfolding into a smaller five wave pattern, taking the form of an ending-contracting diagonal - primary wave 3 in progress projecting declines towards 3.000%. Ultimate targets for wave 5 of C measure towards 3.205 several years into the future. |
US 10YRYIELD - JUNE 17th 2003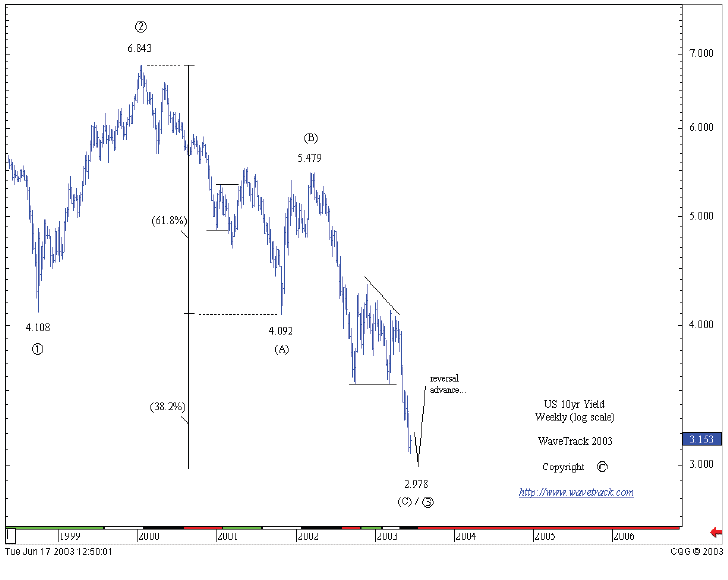
fig 2 10yr Yield - Weekly |
June 17th 2003 – Primary wave 3 has declined into target area at 3.000% per cent. It is shown unfolding into a single zig zag pattern and subdividing into intermediate degree, (A)-(B)-(C). Extending wave (A) by fib. 61.8% projects the finalisation of wave (C) towards 2.978+/-. The traded low at this time was 3.069 and this effectively marked the absolute low. Yields promptly began a prolonged upswing as primary wave 4. |
US 10YRYIELD - MARCH 16th 2004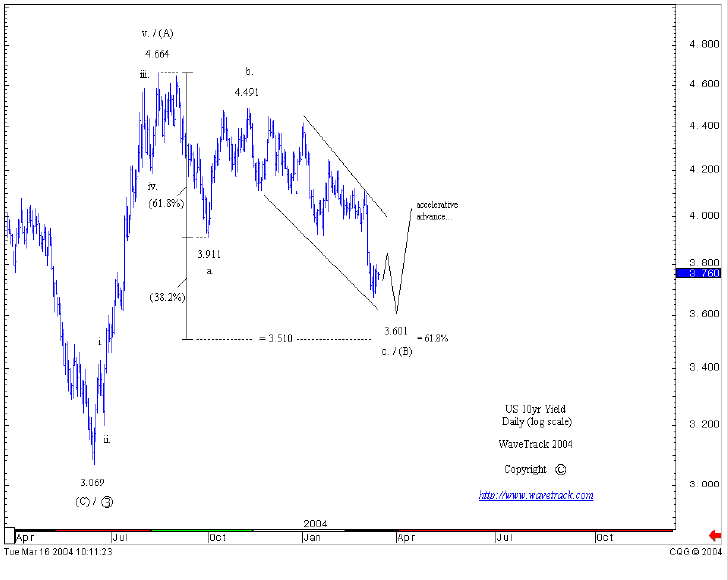
fig 3 10yr Yield – Daily |
March 16th 2004 – Primary wave 4 ’s advance from 3.069 is expected to unfold into a single zig zag pattern subdividing into intermediate degree, (A) (B) (C), 5-3-5. Wave (A) completed a five wave advance to 4.664 and is followed by wave (B) declines. At the time of this update, wave (B) was approaching completion, measured to 3.601-3.510 by extending minor wave a. by fib. 61.8% and converging with fib. 61.8% support. The actual low recorded was 3.646 resulting in an accelerative reversal that began the next advance as intermediate wave (C). |
US 10YRYIELD - JUNE 21st 2004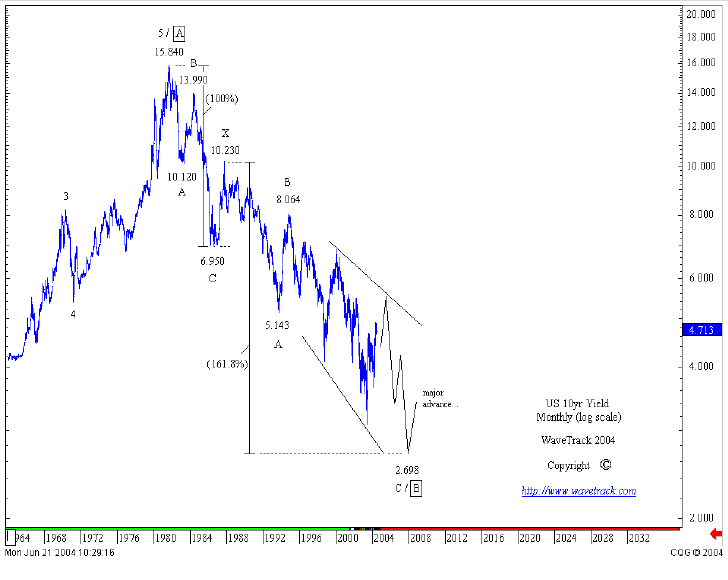
fig 4 10yr Yield – Monthly |
June 21st 2004 – With reference to the previous chart, intermediate wave (A) of primary wave 4 was itself a large advance from the 3.069 low, and when this high of 4.664 was extended by fib. 61.8% to project wave (C)’s high to 5.651, we recognised this would change the contracting diagonal pattern into an expanding variation. This monthly chart includes the expanding diagonal as cycle wave C for the first time. It also lowered ultimate downside targets from 3.205 to 2.698. |
US 10YRYIELD - JUNE 21st 2004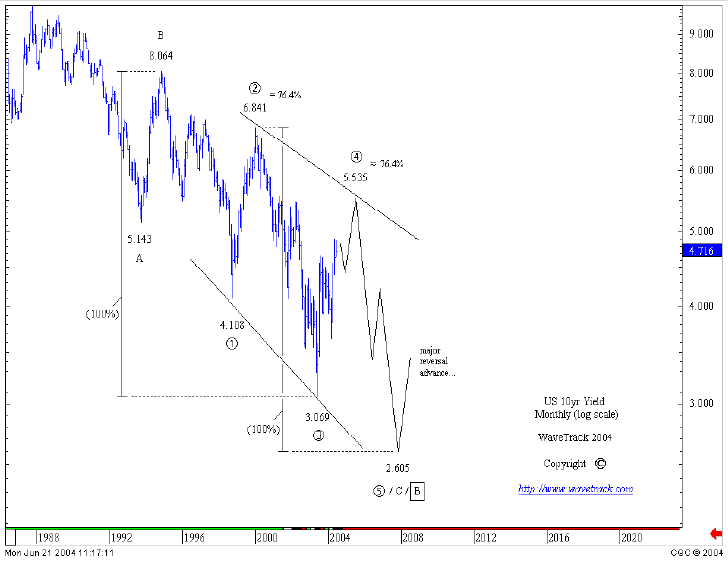
fig 5 10yr Yield - Monthly |
June 21st 2004 – This chart published on the same date as the monthly focuses entirely on the ending-expanding diagonal pattern. The revised upside targets for primary wave 4 are included towards 5.535, measuring a fib. 100% equality ratio for intermediate waves (A) and (C). After the completion of wave 4, a reversal decline is forecast to begin forcing yields sharply lower as primary wave 5. Fifth waves within expanding diagonal patterns are the most accelerative, and severest of the impulse sequences, 1-3-5. Ultimate downside targets are towards 2.605. This forecast was indicating an event-driven catastrophe for the economy lies ahead – why else apart from a recession, or worse, would this pattern depict a massive decline? |
US 10YRYIELD - JUNE 6th 2005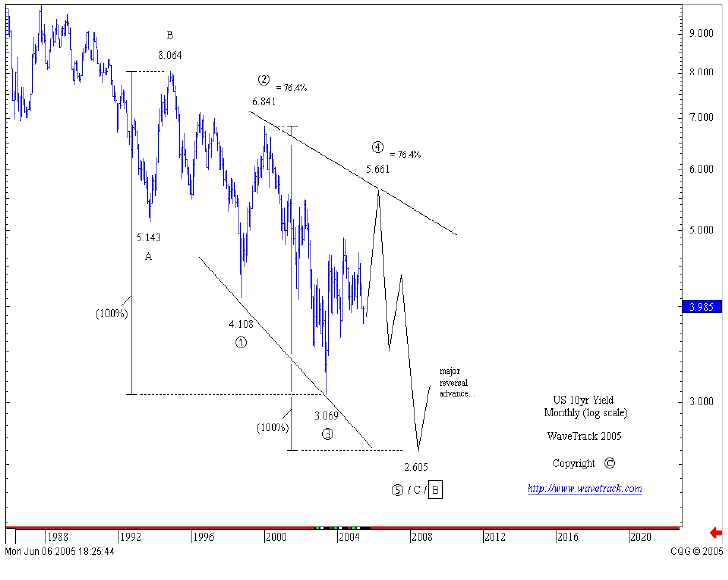
fig 6 10yr Yield – Monthly |
June 6th 2005 – Almost a year has passed and primary wave 4 upside targets remain unchanged at 5.535-5.661. The yield during the last twelve months has drifted lower, but in this update, was forecast to resume its acceleration higher from 3.985. |
US 10YR YIELD - JANUARY 26th 2006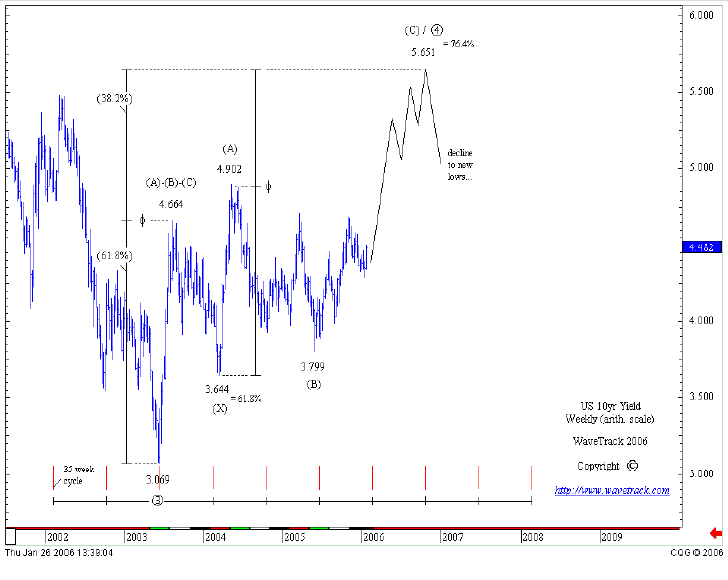
fig 7 10yr Yield - Weekly |
January 26th 2006 – A continued advance from 3.985 has taken the yield to 4.482 but there is still a long way to go to complete the high for primary wave 4. Upside targets are still fixed towards 5.651 but we have changed the pattern from a single zig zag to a double pattern to justify the three wave decline unfolding from 4.902 to 3.799. |
US 10YRYIELD - JUNE 11th 2007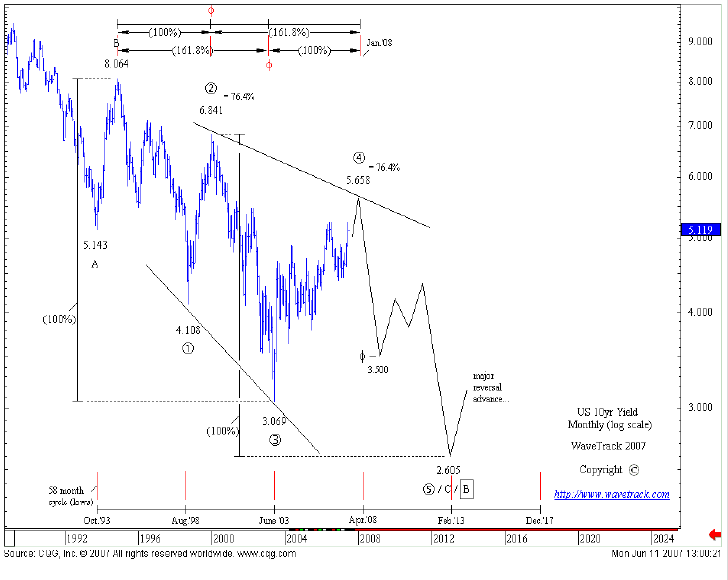
fig 8 10yr Yield - Monthly |
June 11th 2007 – The last stages of primary wave 4 ’s advance are closing in on the 5.658 area. We realise a reversal signature would verify its end at any time. The yield traded another 20 basis points (bps) higher to 5.382 then staged its reversal to complete primary wave 4 from its beginning in June ’03 to its high in June ’07 – four years later! The annual cycle has created major reversals ever since! The downside forecast for primary wave 5 can hardly be believed – to 2.605 per cent, a total decline of 277 bps. Wave 5 must subdivide into a single zig zag (or multiple sequence, i.e. double) and we can immediately gain an insight to intermediate wave (A)’s downside target by cutting the entire decline by fib. 61.8% - projecting 3.500%. |
US 10YRYIELD - MAY 5th 2008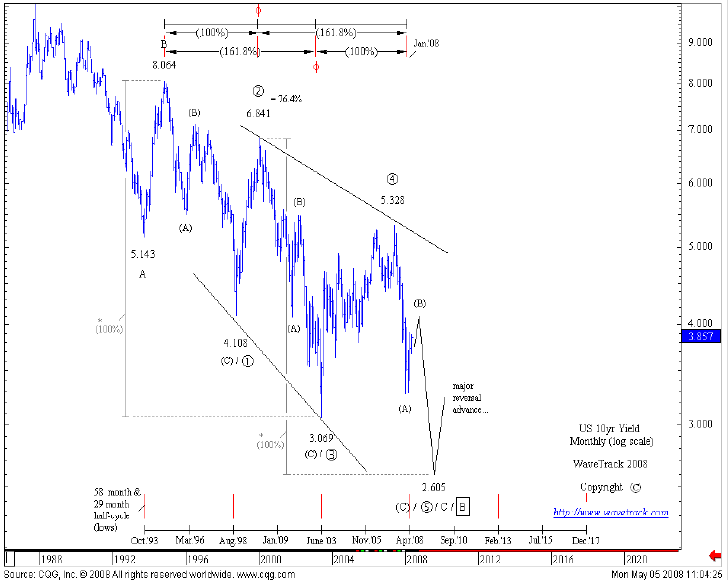
fig 9 10yr Yield - Monthly |
May 5th 2008 – The yield collapsed and settled at 3.284 to end intermediate wave (A) – a total decline in this first phase of 209 bps, and only a deviation of 21 bps from original forecasts. Wave (B) rallies are expected to be short and quick in recovering, about a 50% retracement, then declines to resume as wave (C) with targets to new 21st century lows. Downside targets remain unchanged at this point, although we have issued a warning that wave (A) could be extended by fib. 61.8% to produce a lower target at 2.435. |
10 YR YIELD - JANUARY 19th 2009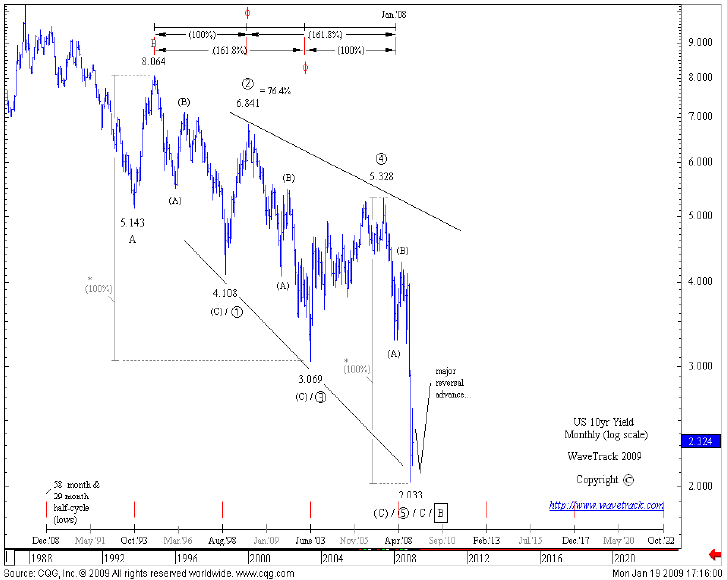
fig 10 10yr Yield - Monthly |
January 19th 2009 – Intermediate wave (C) effectively collapsed, breaking even our most ambitious downside targets of 2.605-2.435 momentarily trading at a low of 2.033%. This is typical of exhaustion sell-offs, especially characteristic of 5th waves within ending-expanding diagonal patterns. Task completed! Not only has primary wave 5 ended, but the entire diagonal pattern that began from the high of Nov. 1994 – 14 years in the making. But this also marks an historical low because the entire double zig zag pattern has also ended from its start point in 1981 at 15.840%. What next? As you can imagine, now that the medium-term counter-trend decline has completed, the yield resumes its long-term uptrend – the only question remains is this - how quickly do yields begin to rise and for how long? |
|
END | FIN | ENDE |
