

NEWS ALERT |
IDENTIFICATION OF A RARE DOUBLE-THREE (D3) PATTERNThe 'double-three' and 'triple-three' patterns were not an integral inclusion to R.N.Elliott's original publication of 'The Wave Principle' (1938) but did feature in the later monograph of 'Nature's Law' (1946) although its discovery and classification were still in their formative stages of refinement. They are part of the counter-trend series of patterns that describe horizontal/sideways price activity. Elliott made the distinction between simple 'corrections', e.g. zig zag and flat and 'complex corrections' that included the 'triangle' but also the double & triple three formations. The double-three is composed of 7 seven horizontal waves (price swings) and the triple-three 11 eleven. Once completed, the direction of the preceding trend resumes, whether this is upwards or downwards. Elliott noted that double & triple-threes can 'slope' in an upward/downward angle. They are still composed of seven and eleven wave sequences and he makes a brief statement that "Occasionally these threes are mixed in upward and sidewise [sic], or downward and sidewise [sic], as in figures 27 and 28 (double threes mixed), and 29 and 30 (double threes upward)" – see fig #1.
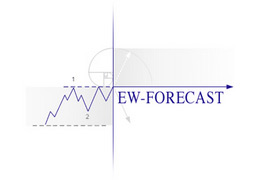
The brilliant analyst of Bolton-Tremblay, A. Hamilton Bolton had read extracts of Elliott's Wave Principle that were published in the Financial World Articles of 1939 and much later, long after Elliott's death in 1948 published a monograph entitled 'the Elliott Wave Principle' in 1960. It was written in a very candid manner, offering praise and criticism as the title implies. This was the first significant publication of Elliott's work since 'Nature's Law' and it resurrected interest from several prominent quarters. Now on page 38, Bolton comments on the 'complex' double/triple-three patterns and states, "Just as the zig zag can broaden out into a DOUBLE ZIG ZAG, so too one can find DOUBLE THREE's and TRIPLE THREE's". Very little else was mentioned on these patterns. There were no instructions on subdivisions, how each wave would unfold, nor were there any guidelines on how far the 'sloping' angle could extend. When Frost/Prechter published their combined book 'Elliott Wave Principle' in 1978, this illustrated a tutorial 'combination' D3 graph taking the form as a ZIG ZAG-X-FLAT pattern consisting of 7 seven waves but exactly horizontal – there was no illustration of the D3 sloping chart. It did however expand upon the subdivisions of each wave, “Within a double or triple three formation, the waves in the direction of the previous trend…always subdivide into threes…while those in the direction of the corrective wave can subdivide into threes or fives, depending upon what simpler types of corrective patterns are forming within the structure”. Having personally archived thousands upon thousands of Elliott's patterns over the last twenty-five years or so, I began to wonder if the double and triple-three patterns actually exist? – I have viewed perhaps a handful of probable candidates, that's all, and there is scant reference to them anywhere. The most thorough attempt at illustrating them was undertaken by Robert Balan in his book 'Elliott Wave Principle – Applied to the Foreign Exchange Markets' (1989) where he lists several that are 'sloping'. Now it occurred to me that as there are sublime harmonic Fibonacci ratio relationships found in all of the patterns that Elliott discovered, these might also exist for the 'sloping' double and triple threes. But then, these are so rare and uncommon to the markets that they are almost an extinct species – and questionable if they really existed in the first place as no footprints have ever been found or rarely documented. Some years ago when I was creating the double and triple three charts for WaveSearch (our Elliott Wave tutorial tool), the sloping patterns were illustrated to show a fib. 38.2% extension ratio of the sideways section of the pattern to depict the final termination of the second. This was based off just a few possible sightings that I've recorded so far – see example in fig #2. This tutorial chart describes the horizontal section of the pattern unfolding into an expanding flat pattern labelled (A)-(B)-(C) [3-3-5] with wave (X) as any corrective pattern and then the sloping section unfolding into a single zig zag (A)-(B)-(C) [5-3-5]. You can see that I've extended the price-extremity of the expanding flat by a fib. 38.2% ratio to offer some 'sloping', but not too much as to distort the intention of 'sideways' activity that Elliott himself intended to convey. Finding real-life examples is another thing!
Amazingly, one excellent candidate did arise just recently, and I was quite excited to capture it. But I had to wait sometime afterwards to ensure the following price action did not somehow invalidate it – nevertheless, here it is, and shown unfolding as a double-three; Flat (-expanding) - X (triangle) – Zig Zag (single), seven waves in total – see fig #3.
It is shown unfolding in the July ’11 Crude Oil futures contract and is acting as the counter-trend corrective sequence of the preceding decline that unfolded between 105.16 to 95.81. Notice that extending the expanding flat by a fib. 38.2% ratio projects the conclusion of the zig zag sequence to 103.39. The effects afterwards are clear to see – prices then resumed their downtrend, breaking below the preceding lows, in effect, isolating the double-three and providing a ‘proof’ of its existence. Sincerely,
Peter. P.S.: If this article inspired you or raised questions – we invite you to leave your comments here! 
END | FIN | ENDE |
Recent News Alerts


|