OUTLOOK & FORECASTS FOR 2011 |
Panel Presentation | Society of Technical AnalystsOutlook & Forecasts for 2011 – WaveTrack International
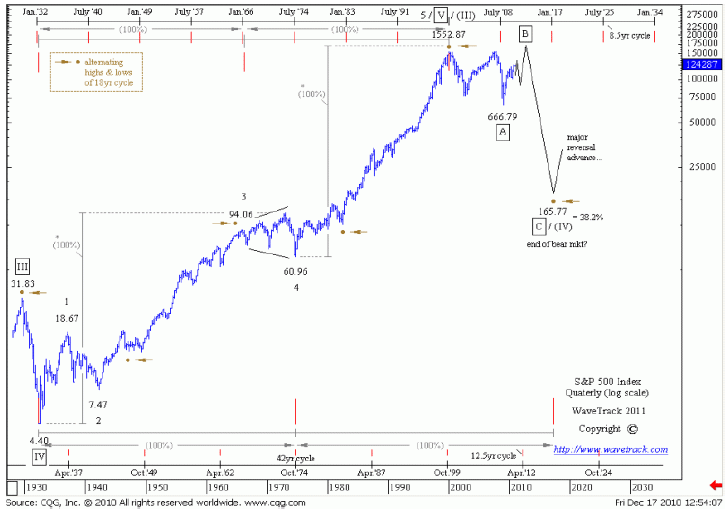
Equities/Stock Indices Highlights of Presentation:This analysis centres around the S&P 500 that is used as a proxy for other global indices. The great bull market beginning from the 1932 low ends 68 years later in 2000 - other global indices peaked later in 2007 (75yrs) – some still continuing to progress. In order to understand the logic of the 2011 trends and price-forecasts, we have described and illustrated how these fit together within the greater pattern sequences that date back to 2000 and look forward to the 2016-18 period. Three time & price degrees of trend are introduced – long-term/super-cycle, medium-term/cycle and intermediate-term/primary.
|
|
|
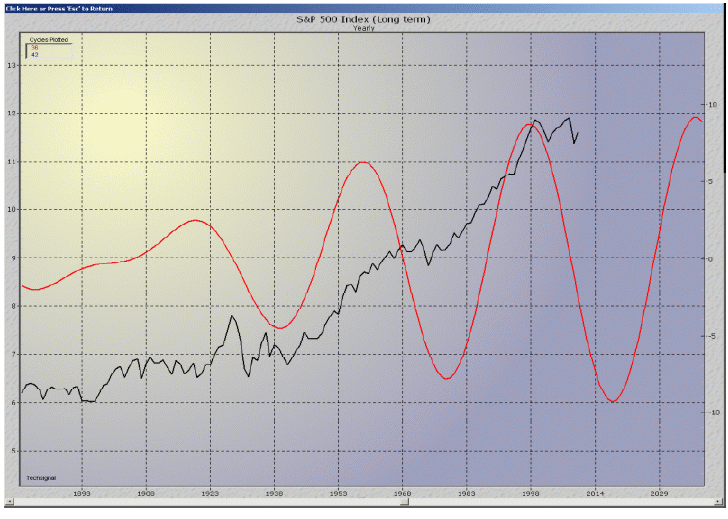
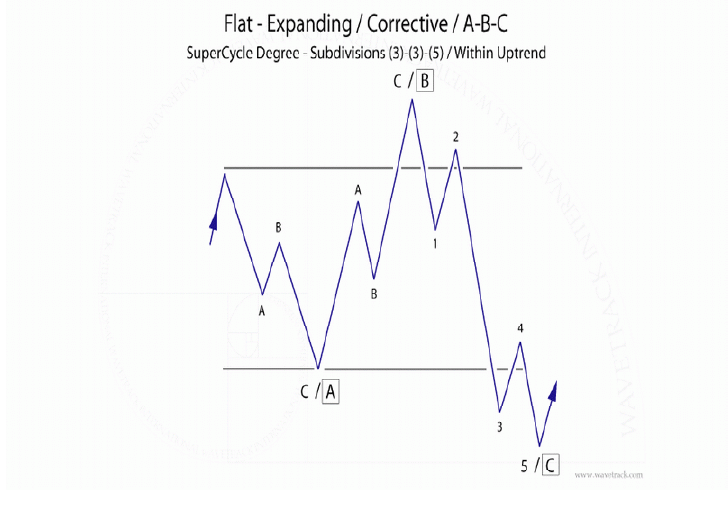
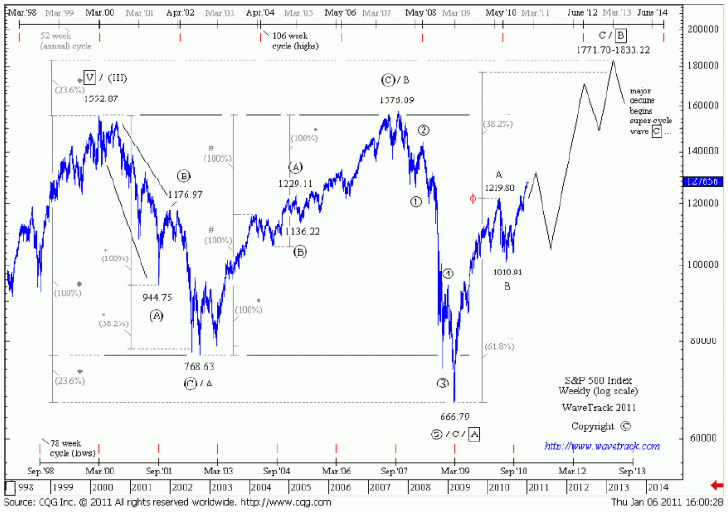
The counter-trend bear market for the S&P 500 is forecast to unfold into an expanding flat pattern, A-B-C (super-cycle degree), subdividing 3-3-5. Super-cycle wave A completed from the 2000 high into the '09 low. Subsequent advances labelled wave B with ultimate targets into new record highs (S&P) – other global indices will underperform and remain below their current historical highs – see fig's #1 & 4. Much later, a major collapse as super-cycle wave C is assigned high probability event. |
|
|
|
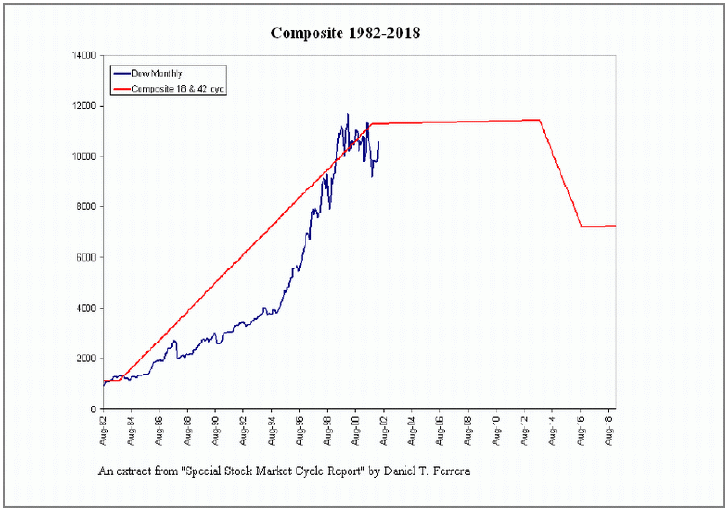
Long-term cycles focus primarily on two time-intervals – 42 & 36 year periodicities. The 42yr cycle develops with right-translation – up 39yrs, then down sharply in 3yrs. The 36yr cycle develops with central translation – alternating 18yrs up/down. The composite cycle combining these together has peaked and confirms the long-term bear market – see fig #2. |
|
|
The directional 18yr uptrend of the 36yr cycle peaked in 2000 and now heads lower for another 18yrs until a low forms in 2018. Whilst the 39yr period of the 42yr cycle exerts higher until 2013, the 18yr is influencing lower, cancelling each other out. This is the reasoning behind such volatile price movement during the last decade. Declines into the 2016-18 date is expected to form a typical double-bottom formation for global indices – see fig #3. |
|
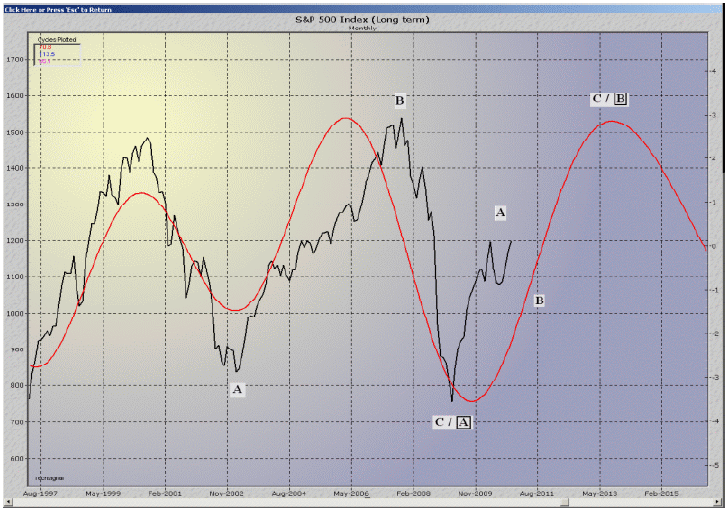
The 39yr period of the 42yr cycle peaks in the year 2013 – this is expected date for completing super-cycle wave B's current advance into record highs (S&P). The following 3yr period is expected to force prices down sharply into 2016 for the completion of super-cycle wave C. |
|
|
|
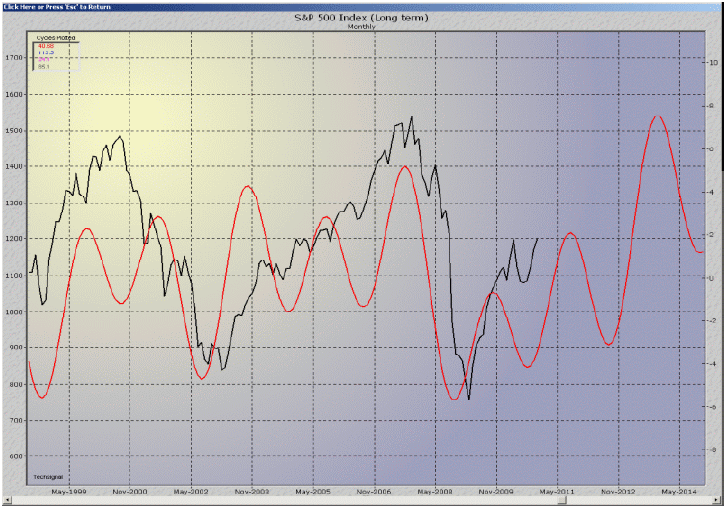
Medium term cycles focus on three periodicities, 113.50, 85.10 & 70.80 months - combined into a composite indicates a general uptrend in progress from the Oct.'08/March '09 lows with its peak into early 2013, converging with the conclusion of the 39yr period of the greater 42yr cycle – see fig #5. |
|
Global indices share a common theme following the post financial crisis lows of '08/'09. Many have advanced into typical Elliott five wave impulse patterns. This results in two immediate conclusions: first, a five wave advance of this kind eliminates an imminent decline that collapses below the Oct.'08/March '09 lows from consideration – second, it vindicates higher price levels 18 months from now because a five wave pattern located in this position must be followed sometime later by another of at least equal amplitude (Fib. 100% equality). |
|
|
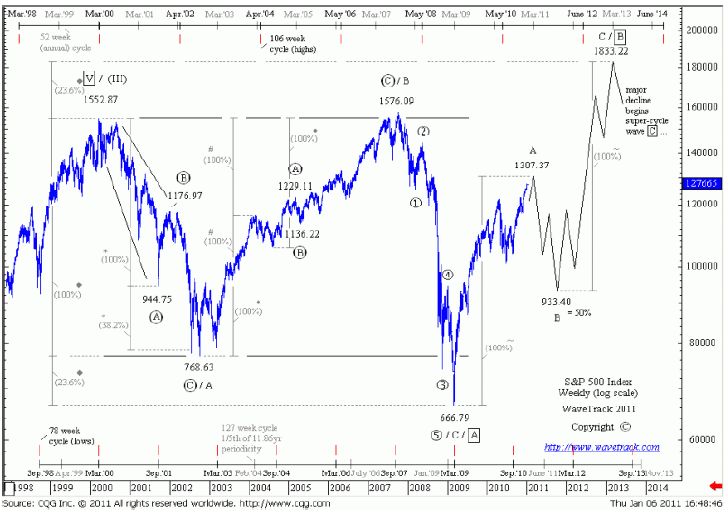
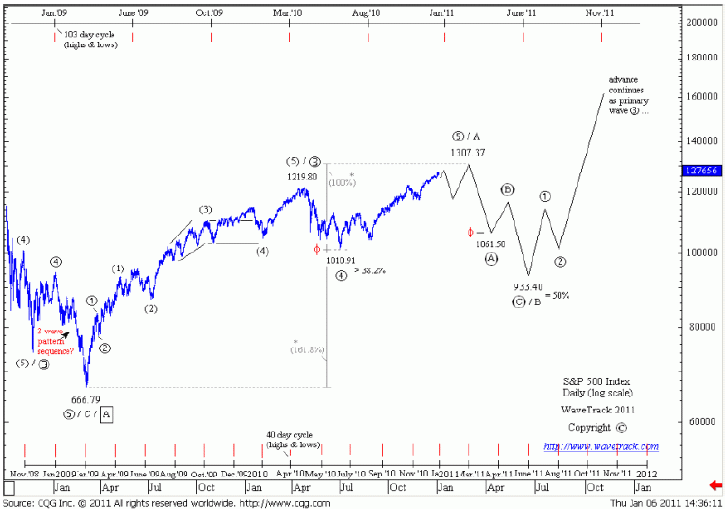
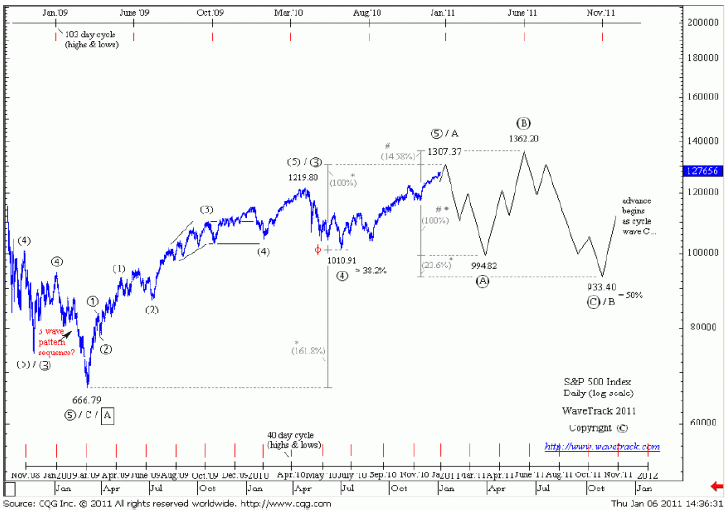
This underlines the progress of super-cycle wave B's advance from the Oct.'08/March '09 lows unfolding into a zig zag, an A-B-C 5-3-5 sequence resulting in new record highs for the S&P and some other global indices. The S&P's advance from the March '09 low as super-cycle wave B is expected to unfold into a single zig zag pattern, labelled A-B-C in cycle degree. Two locations are currently considered for the completion of wave A – either the April '10 high at 1219.80 or alternatively towards targets slightly above 1300.00 – see fig's #6 & #7. |
|
|
|
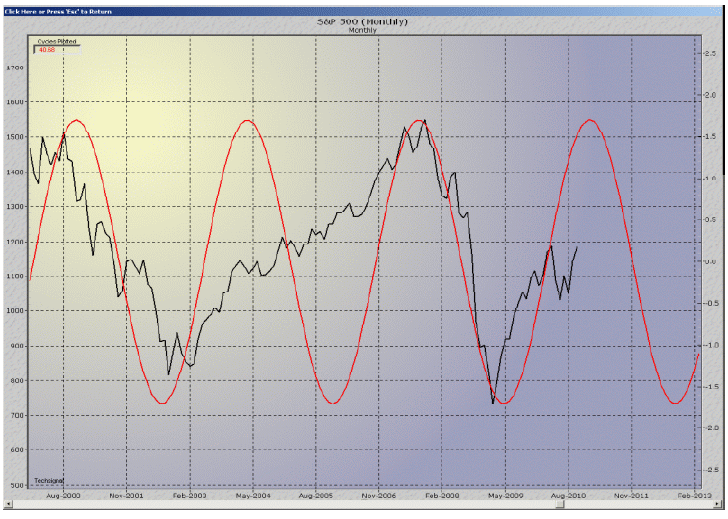
The consistency for both is that a significant high can be expected by latest end Q1 2011 with prices turning down afterwards. This is supported by the reliable 40.68 month cycle that has approximately timed most of the intermediate-term price swings since the bear market began in 2000 – see fig #8. |
|
The difference between the two scenarios displaying alternative locations for the completion of cycle wave A will become evident later once the S&P begins to decline. The first has more limited downside possibilities because this would be labelled primary wave 2 within cycle wave C – wave 1 began from 1010.91 and so wave 2 must end above this low. The second does not have this constraint because the decline would be labelled one degree higher, as cycle wave B with its own limit below 666.79, wave A's starting point. In reality, a fib. 50% retracement level is targeted to 933.40. |
|
|
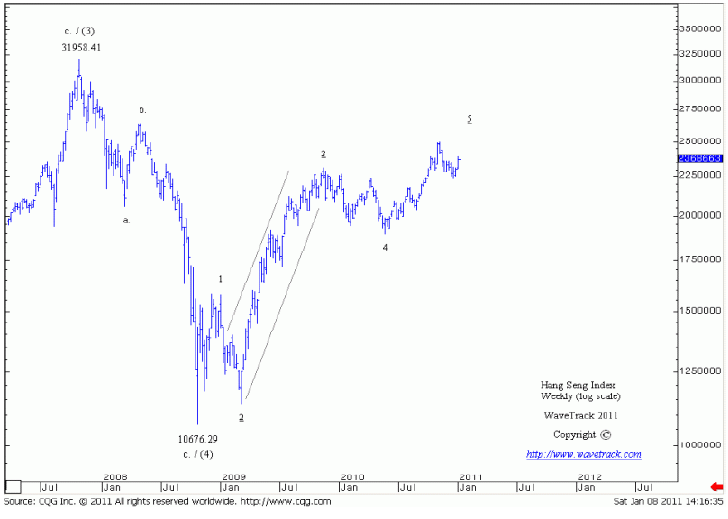
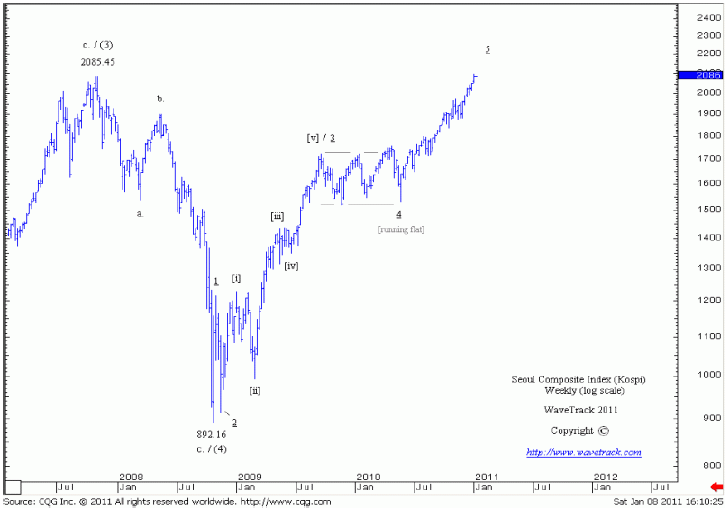
The second scenario has credibility for two reasons – first, the decline into the July '10 low at 1010.91 measures uncommonly small to qualify the completion of cycle wave B (as the first scenario describes, less than fib. 38.2%) – second, when compared to other global indices such as the Hang Seng and the Kospi, these suggest an expanding five wave impulse pattern is only now approaching completion from their respective lows of Oct.'08 – see fig's #9 & #10. This justifies the same five wave pattern ending cycle wave A for the S&P. |
|
|
The depth of cycle wave B's decline is expected towards the fib. 50% area at 933.40 as this would provide the platform for an identical advance of wave A to be measured for the following advance as wave C with targets towards 1833.22+/-. This would form a convergence for the completion of super-cycle wave B where wave A is extended by a fib. 23.6% ratio (refer to fig #7). Such harmonious convergences are commonly found for 'B' waves within expanding flat patterns. |
|
|
|
The question now remains as to what type of counter-trend pattern will unfold as cycle wave B during the months following March's expected high? The decline can take a simplified form of a single zig zag, developing as primary waves A-B-C – see fig #11. If so, a low can be expected before year-end '11. An 'alternative' scenario for wave B is unfolding into an expanding flat pattern, therefore consuming a lot more time. |
|
It would create a secondary high before declining to the ultimate downside target at 933.40. An intermediate-term composite cycle chart comprising of four different time-periods and including the 40.68 month periodicity holds higher until June '11 before relinquishing its role – see fig #12. Such an event would create a slightly higher high into June before declining hard afterwards, probably extending its conclusion into early 2012 – see fig #13. |
|
|
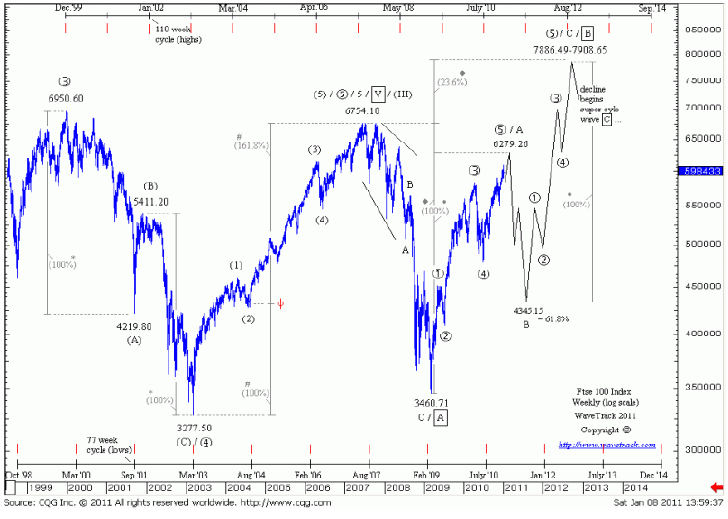
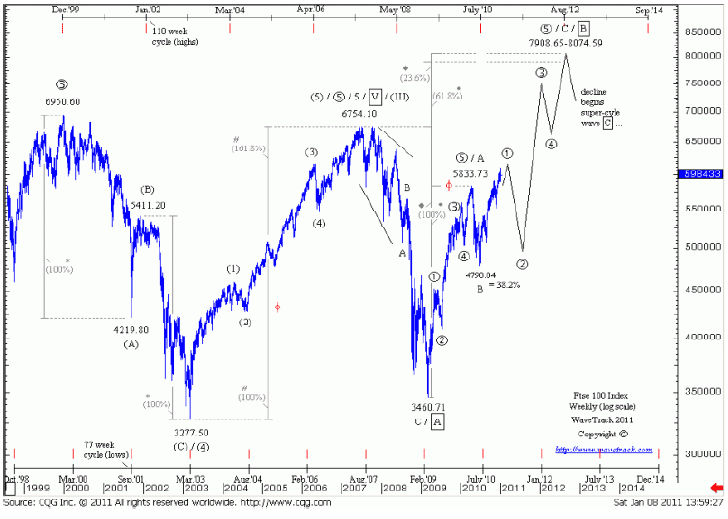
The final two charts illustrate the London Ftse 100 forecasts under the same format as the S&P – see fig's #14 & #15. |
|
|
Peter is the founding partner of WaveTrack International and has published Elliott Wave analysis for over twenty years. He is the author of the monthly EW-Navigator and the short-term EW-Compass reports – www.wavetrack.com END | FIN | ENDE |
