

THE FLASH CRASH |
|
2 hour response to the 'Flash Crash' sell-off on 6th May 2010
|
|
|
The S&P's sharp sell-off on the evening of the 6th May was at the time, attributed to a large sell order that was mistakenly executed in 'Procter & Gamble' that sent the share price tumbling from about 61.00 to a low of 39.37 before staging a recovery. Meanwhile, news-wire services were broadcasting the worsening crisis in Greece with televised pictures of street rioting in the capital, Athens. Whatever triggered the actual sell-off may never be known, but despite this frantic and volatile action with the S&P falling over 111 points in a matter of minutes to a low at 1065.79, the existence of Elliott Wave patterns were visibly evident. The low at 1065.79 was soon left behind as a massive rally took hold in the minutes that followed, pulling the S&P higher to 1133.22. At this time, we decided to take an intricate look at the pattern sequence in this advance in order to determine whether this was a momentary counter-trend recovery that would be followed by yet another collapse, or alternately, would represent a more sustained upswing to even higher levels – [see fig. #1] & [see fig. #2]. |
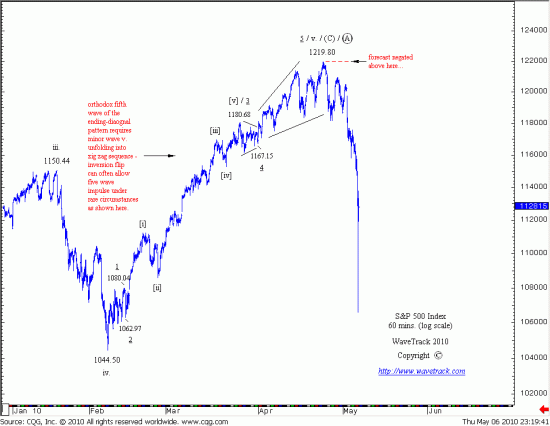 fig. #1: S&P500 Index 60 mins
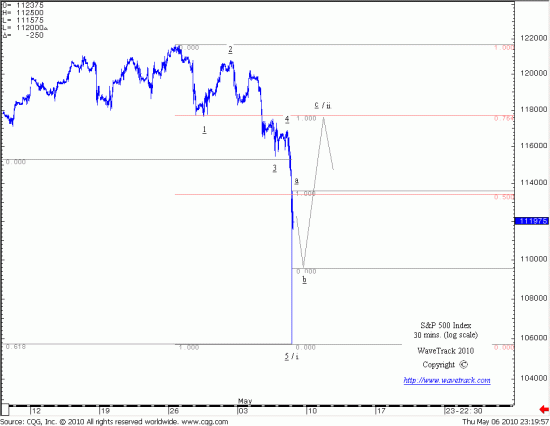 fig. #2: S&P500 Index 30 mins
|
|
What we found was intriguing. Examining tick-data, we could see the advance from
1065.79 to 1133.22 had unfolded into an Elliott five wave pattern, an expanding impulse. Using tried and tested fib-price-ratio analysis, we set about publishing our short-term video update – this resulted in forecasting a single zig zag recovery to unfold from the 'Flash-Crash' low of 1065.79, unfolding into minute degree, a-b-c with minute wave a ending at 1133.22, wave b declining the next day into fib. 50% retracement targets towards 1093.87 then another five wave advance to begin afterwards as wave c with ultimate upside targets towards the 1175.00+/- area – [see fig #3]. |
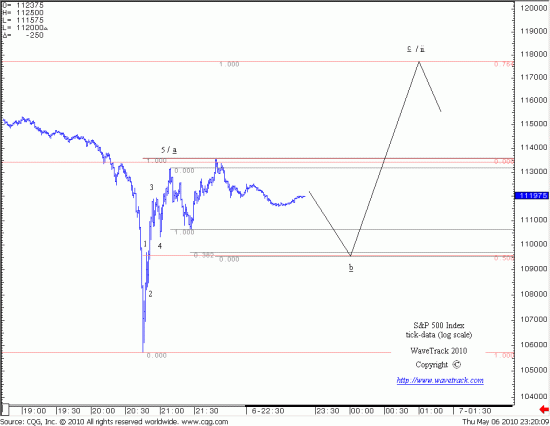 fig. #3: S&P500 Index tick data
|
|
The actual price action unfolding during the next several trading days was quite amazing to watch – sure enough, the S&P began to decline from minute wave a's high, developing wave b as an expanding flat correction. The following day, Friday 7th, the S&P traded down to its target level of 1093.87, the actual low recording 1090.75 (E-mini S&P) and 1094.15 on the cash S&P 500 index. It held the fib. 50% support perfectly. A sharp price-rejection was enough to qualify a reversal signature that informed us that minute wave c was already underway – [see fig #4]. It took the best part of four additional trading days into the following week for the S&P to trade into the upside targets at the 1175.00 area, the actual high recorded 1174.75 (E-mini) and 1173.56 (cash). It was now necessary to confirm the end of wave c as minor wave ii. two with another price-rejection away from this level. The following day, Friday 14th, the S&P declined by over twenty points, more than enough to qualify a reversal. The next short-term update forecast a sharp accelerative decline as minor wave iii. three, ultimately breaking below the 1065.79 lows – the rest is history – [see fig #5]. If you’d like to see the exact fib-price-ratio measurements used in creating this forecast, just click on the video link to watch the drama as it transpired on the evening of the 6th. COMING SOON! A new short-term update service published 3 x week and analysing Elliott Wave patterns for stock indices, currencies, bonds and gold. Watch this space for release updates & scheduling – have you already completed the 'Registration' and provided your contact details? – then receive the latest information directly into your e-mail box. To 'Register', please go the registration area, or click here.
END | FIN | ENDE |
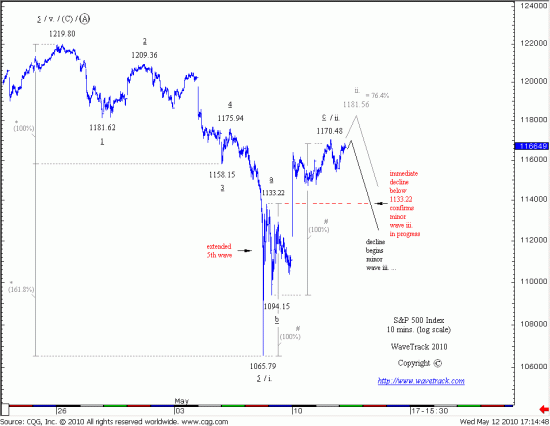 fig. #4: S&P500 Index 10 mins
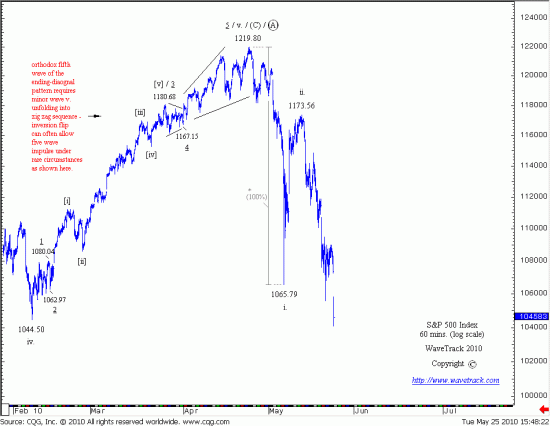 fig. #5: S&P500 Index 60-mins
|
