FINANCIAL FORECASTING VIDEOS & TUTORIAL VIDEOS |
VideosOutlook & Forecasts for 2013 VideoCategory: Tutorial
The S&P 500 is used as the international benchmark/proxy for global stock indices. The great bull market beginning from the 1932 low ends 68 years later in 2000 - other global indices peaked later in 2007 (75yrs) – some, especially those of Asia, remain incomplete. In order to understand the logic of the 2013 trends and price-forecasts, it is necessary to find a common denominator that not only conforms to the overall pattern progression for each index as defined by the Elliott Wave Principle (EWP), but synchronises the up and down swings accordingly. This study identifies shared commonalities taking a few examples from a larger resource then plotting the most probable path market price action will follow during the next year and beyond. WaveTrack Update Alert - The Flash CrashCategory: Tutorial
The Update Alert! messaging service of EW-Forecast Plus responded to the sharp collapse and the following recovery of US stock indices during the volatile trading session on the 6th May. 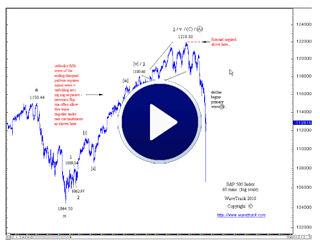
Outlook & Forecast for 2011 - Equities/Stock IndicesCategory: Presentation
This analysis centres around the S&P 500 that is used as a proxy for other global indices. The great bull market beginning from the 1932 low ends 68 years later in 2000 - other global indices peaked later in 2007 (75yrs) – some still continuing to progress. 
The Deflationary ScenarioCategory: Presentation
Presentation to Fund Managers & Institutions – Hong Kong, June 7th 2010 | By – Peter Goodburn This index is the original cash index that was launched in 1971, not to be confused with the Thomson-Reuters/Jefferies version that first traded in 2005. The CRB cash index is our benchmark to analyse long-term trends because ... 
|
