

NEWS ALERT |
DOW JONES BREAKS ABOVE 2011 HIGHThe Dow Jones has just recently broken above the 2011 high of 12876.00. This is the third indication of a larger bullish scenario that has begun unfolding in the wave count process from the Oct.'11 low. The first was the initial upswing into the Oct.'11 high to 12284.30. This advance unfolded into an expanding five wave impulse pattern. The second was a distinct and clearly visible zig zag correction into the Nov.'11 low to 11231.60. And now this third event - a break above the 2011 highs – see fig #1. So what does all this translate into?
First and foremost, it affirms our medium term bullish count that asserts the entire upswing from the March '09 low of 6470.00 has much more to do and that it remains incomplete. It also disqualifies and negates the 'mainstream' Elliott Wave opinion that a major collapse of historical proportions is just around the corner. In contrast to this, our grass-roots analysis of wave pattern combined with ratio and proportion guidelines have correctly forecast the major turning-points throughout this entire period. If you have found yourself selling all the way up into this advance only to be repeatedly stopped-out of your position, does this not trigger steps of re-evaluation? Mainstream Elliott Wave analysis has been focusing on a series of erroneous 'interpretations' to suggest the resumption of the larger downtrend would unfold from the May '11 highs of 12876.00. This forecast is also based upon the subsequent upswing from the Oct.'11 low of 10404.50 as a counter-trend pattern, but this cannot be since the Dow Jones has now broken above this extremity. Yes, the world is engulfed in financial disarray. Yes, governments are technically bankrupt. Yes, long-term cycles in stock indices, bonds and commodities are in the process of change - all good arguments that can lead to the assumption that a more immediate stock market collapse is just around the corner – or is it? But these factors are based upon the weaknesses inherent in 'subjectivity' and 'opinion'. They are erroneous 'timing' errors in the construction of a wave count that otherwise uses 'Ratio' & 'Proportion' guidelines to pinpoint and plot a more reliable course for stock market price activity. Think of this for a moment. When you next look at a chart of the Dow's advance from the March '09 low of 6470.00, what do you see? Do you see a completed zig zag with all the inherent qualities of this pattern – where waves 'A' and 'C' unfold to a fib. 100% equality ratio relationship with subdivisions of 5-3-5? Maybe compare this same advance with the DJ Transportation Average, the S&P 500 and the Nasdaq. Surely one of them will reveal this most basic measurement guideline? Well, in fact, not one of them does! – for comparison to the tutorial zig zag chart, see fig's #2/2a, #3/3a, #4/4a & #5/5a. |
Recent News Alerts


|
|
|
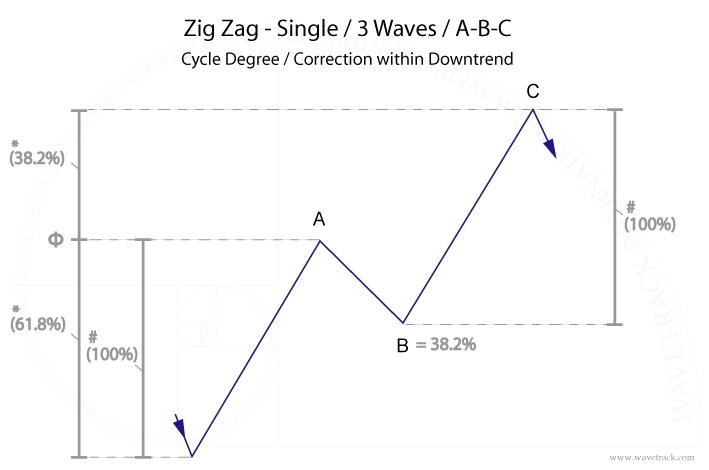
Archetypal single zig zag with standardised Ratio & Proportion measurements |
|
|
Archetypal single zig zag with standardised Ratio & Proportion measurements |
|
|
Archetypal single zig zag with standardised Ratio & Proportion measurements |
|
|
Archetypal single zig zag with standardised Ratio & Proportion measurements |
|
In fairness, not all zig zag patterns unfold to this ratio – two other fib-price-ratio guidelines exist. The first is where wave 'A' is extended by a fib. 61.8% ratio to project the conclusion for wave 'C', and the second by extending wave 'A' by a fib. 38.2% ratio but this is only valid where wave 'B' has retraced by a minimum 50% ratio. This condition is necessary in order to prevent wave 'C' appearing too short as compared to wave 'A'. Sometimes, wave 'C' unfolds a little shorter than wave 'A' in circumstances like this but not so short that it opens the door to 'alternate' counts. For example, if the upswing for wave 'C' exceeds the preceding high for wave 'A' by a small margin, how then do you know if this is the completion of wave 'C' or alternatively, wave 1 of 'C'? There is a common error in the wave counting process when allowing by 'default' wave 'C' to be shorter, quite a bit shorter, than wave 'A'. To correct this, there should always be an attempt to create a harmonious proportionality ratio between these two waves. Yes, there are times when wave 'C' will be shorter than wave 'A', but this is the exception, not the rule! Maintaining proportionality in double zig zag patterns is also essential – A-B-C-X-A-B-C. For example, the completion of the first zig zag is followed by a retracement of wave 'X'. When the secondary zig zag unfolds and extends only slightly beyond the completion of the first, how do you know whether this is the completion of the secondary zig zag sequence, or simply the ‘b’ wave of an expanding flat (or triangle) as part of wave ‘X’? The answer again lies in ratio and proportion measurements. If a secondary zig zag unfolds far beyond the completion of the first in such a way that its measures by a fib. 100% equality ratio of the first, then this provides a certification of probability that it has ended the entire double zig zag pattern in the same degree of trend. But should a zig zag extend only marginally beyond the first, beware! This can and most probably is, a lower wave degree zig zag compared to the preceding pattern that instead becomes the 'b' wave of a larger expanding flat or even a triangle for wave 'X' ('B' or '2') – see fig's #6 & 6a. Without fib-price-ratios, there is no way to evaluate and ultimately differentiate between these two examples. Prove it to yourself – for the next several weeks (if you have access to intra-day short-term data) or months, test this most basic guideline out. |
|
|
|
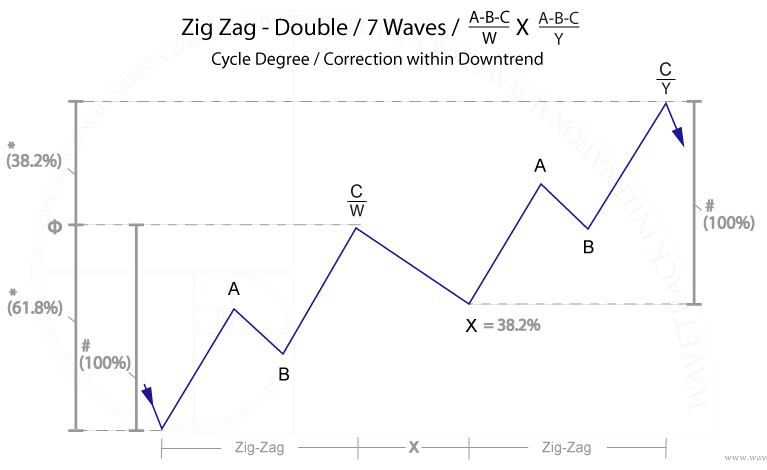
Archetypal double zig zag with standardised Ratio & Proportion measurements |
|
The advance from the March '09 low of 6470.00 remains incomplete applying 'ratio & proportion' guidelines, and this most basic tenet translates into an entirely different outlook than 'mainstream' EW analysis currently expounds. Remove the 'opinion' bias of human subjectivity and get back on track! It's time to ring the changes. Using shorter-term sentiment indicators to project the 'bigger' picture creates distortions in the evaluation process. Citing growing government debt as an imminent indicator for a stock market crash of historical proportions is mis-timed. A more reliable guide is instead based upon R.N.Elliott's original discourses of 'Ratio' and 'Proportion'. Using these guidelines maintains a credible and accurate outlook of the future direction, amplitude and velocity of the financial markets. Check this out – take a look at our track-record of last years' decline and prove to yourself whether ratio and proportion guidelines are working in that frenzied free-fall – see Dow Jones, DJTA, S&P 500 & Nasdaq, fig's #7, #8, #9 & #10. From top to bottom, the decline for the Dow Jones and the broader S&P 500 unfolded into an expanding five wave impulse pattern that could and was mistaken for the resumption of a the larger downtrend. But it ignored the two zig zag patterns that preceded it from the earlier Feb.'11 highs, this making the five wave impulse decline the concluding sequence of a counter-trend expanding flat pattern, (A)-(B)-(C), 3-3-5. The expanding flat pattern has now been confirmed basis the Dow's recent break above the May '11 highs.
LATEST UPDATE! The upswing that followed the Oct.’11 lows has since taken the form of a three price-swing sequence. There are two ways to interpret this – it is either the beginning of a sustained five wave impulse advance that results in a continuation to record highs, or alternatively, a zig zag that is nearing completion that ultimately becomes primary wave B within a larger expanding flat, resulting in a massive -32% downswing into the later part of 2012. How can these two scenarios be differentiated? – through ratio and proportion. Measuring the advance from the Oct.’11 lows using ratio & proportion guidelines reveal a convergence of upside targets that define a zig zag. Price acceleration above will eliminate this probability but price-rejection at this pre-determined measurement will almost certainly confirm a subsequent decline that ends below the 2011 lows – find out more about these upside target levels in our institutional and private client subscription services. If you are responsible for managing the portfolio within an asset management business, a hedge fund, a sovereign wealth fund, a life insurance, pension fund or simply taking responsibility for your personal wealth creation and protection, get in touch with us now. We have outlined the entire price development of the major world indices and other asset classes for the next seven years and beyond with various check points along the way – this is invaluable in helping you maintain out-performance and for the protection of your wealth. With the security and reliability of this approach combining ratio & proportion guidelines to the Elliott Wave Principle, we have found this provides an unparalleled insight into future price trends. For more information on our Institutional EW-Forecast services, please click here for Private Individuals, click here END | FIN | ENDE |