

HOW TO INTERPRET EACH ELLIOTT WAVE CHART FORECAST |
Learn to recognise a 'detour' and still arrive at your destinationLet’s say you intend to capitalise on a five wave decline expected for wave (C) within the zig zag. The price has already declined away from wave (B)’s high and is tracing out three main prices swings – you initiate a short position thinking prices are in a 3rd wave acceleration as part of an expanding-impulse pattern and place a stop-loss above the previous secondary high as this would be wave 2. The price action immediately turns higher and stops you out! Prices remain below the starting point of wave (C) but then turn sharply lower again! Under these conditions, it is probable the five wave impulse for wave (C) is developing into an ending-diagonal – see fig #7 (below). 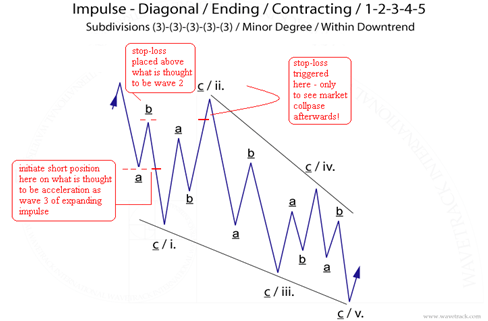
[ref. fig #1 – depicts wave (C) - similar to fig #5 above but with subdivisions added] What seemed like a 3rd acceleration within an expanding impulse was in fact the end of the first wave (itself a single zig zag of smaller degree) of the diagonal, minor wave i. one. For this permutation, the stop-loss was in entirely the wrong location as the 2nd wave rally as minor wave ii. two would commonly be allowed to trade beyond (above as in this case) minute wave b’s high of minor wave i. one of this diagonal impulse pattern. The 2nd wave rally commonly retraces about fib. 76.4% of wave 1, so the correct stop-loss should have been placed above the starting point high of wave (C) and not lower. Prices never traded above the starting point, and eventually completed to the original requirement that wave (C) unfolded into a five wave impulse sequence. Had the stop-loss been placed above the starting point, you would have realised the intended gain for this trade. Knowing the varying permutations of a pattern provides key elements on the implementation of a trade and its successful execution. Tool Tip: in the EW-Forecast software, click on the ‘Tutorial’ tab underneath the ‘Description’ heading, top-right of the page – it illustrates the tutorial pattern depicted and drawn in the forecast chart in the main view screen area – this is intended as a comparative guide to help identify the logic of the forecast. Then ‘mouse-over’ the wave annotations in the sub-heading ‘Permutations’ and a drop-down list will appear. Each wave within the larger Main Pattern details differing possibilities for each sequence, e.g. wave (C) unfolding as a five wave impulse pattern. Out of five possibilities, one is highlighted as the pattern expected to unfold for that larger wave – however, the others remain greyed-out but are included to illustrate the other possibilities should slight price divergences occur. A good exercise is to practice you knowledge of these differing possibilities so that you better understand the risks – as described earlier, there are several ways to reach a destination. |
Table of contents
Further Reading or Featured Tutorial ArticlesOther products |
